We have written many times about the fact that the Earth’s surface temperature record has been so badly corrupted that it is impossible to say whether claims like “2017 was the third-warmest year since thermometers became common in the late 19th century” are true. Temperature records are under the control of agencies like NOAA, which in turn are run by people whose careers are heavily invested in the catastrophic anthropogenic global warming theory.
This is a conflict of interest. It is as though I, when I was a lawyer representing parties in lawsuits, had the option of rewriting the documents on which the case is based, so as to favor my client. Would I have been able to resist that temptation? Well, maybe. But NOAA doesn’t. Over and over again, we find that the temperature records from decades ago have been changed, with no explanation and no transparency. We have documented this fact around the world, and always the “adjustments” are in the same direction–temperatures from decades ago are lowered, and recent temperatures are raised.
The most recent instance comes from New York State, as documented at Not a Lot of People Know That:
There is not the slightest doubt that the US winter of 2013/14 was exceptionally cold by any standards, as the BBC reported at the time: [“Big freeze shatters North America temperature records.”] The NWS wrote at the end of the winter:
The winter of 2013-14 finished as one of the coldest winters in recent memory for New York State. Snowfall across Western and North Central New York was above normal for many areas, and in some locations well above normal. This winter comes on the heels of two previous mild winters, making the cold and snow this winter feel that much harsher.
Temperatures this winter finished below normal every month, and the January through March timeframe finished at least 4 degrees below normal for the two primary climate stations of Western New York (Buffalo and Rochester)…..
Relentless cold continued through the month of January across the region.
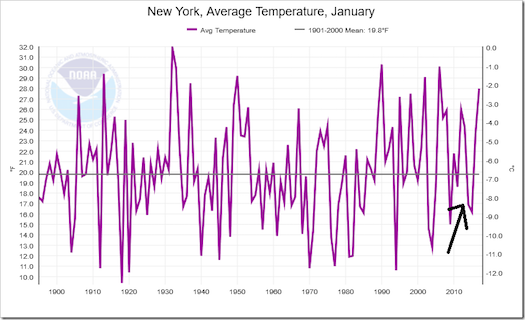
However, when we look at NOAA’s official temperature record for New York State in January, 2014 only ranks as 30th coldest since 1895, with a mean temperature of 16.9F.
How can this be? Simple: if the data don’t fit your theory, change the data. That is the philosophy of the global warming alarmists. Needless to say, this isn’t science.
So I thought I would do some digging into the actual temperature data, to see if NOAA’s version stacks up. I promise that you will be astounded at the results!
***
Since 1889, monthly state climatological reports have been archived, originally by the Dept of Agriculture, and now by NOAA.I have decided to compare Jan 2014 data, with the same month in 1943. According to NOAA, the latter was not dissimilar, with a mean of 18.7F, and a rank of 28th, for Division 10. In other words it was 0.9F warmer than 2014.
Below is the report for January 1943.

It is a good thing these old records are still available, or what would stand in the way of the liberals’ rewriting of history?
Some old stations have dropped out over the years, and new ones taken on. But when we check the 2014 report we find that seven stations are still going. Below is the comparison between 1943 and 2014:

On average the mean temperatures in Jan 2014 were 2.7F less than in 1943. Yet, according to NOAA, the difference was only 0.9F.
Somehow, NOAA has adjusted past temperatures down, relatively, by 1.8F.
The author goes on to point out that the reality is probably even worse than that, since some weather stations have obviously been warmed by human activity since the 1940s–the one “adjustment” that global warming alarmists consistently refuse to make.
The alarmists generally don’t try to explain or justify their “adjustments” to the historical temperature record, they just hope no one will notice. When they do offer an explanation, it generally is based on “time of observation.” That is, if a particular station formerly recorded the temperature at noon, and now records it at midnight, the earlier observations will naturally be warmer and would need to be reduced for an apples-to-apples comparison. (How that adjustment could be carried out accurately, to within a tenth of a degree, is of course another question.) This seems to be the all-purpose excuse for whatever arbitrary “adjustments” are needed to make the CAGW theory look more plausible.
This author addresses that issue:
Apologists for temperature tampering usually say it is all due to TOBS (Time of Observation). Yet the station at Ithaca, based at Cornell University, has used morning readings throughout. With a temperature difference of 2.9C, this is typical of the other sites, suggesting that any bias from TOBS is minor.
The bottom line:
These wholesale changes cannot be explained away changes to individual stations. It may be that homogenisation procedures, infilling of missing data and urban heat islands have contributed.
Under the new nClimDiv system, introduced in 2014, NOAA’s methodology is extremely opaque. They don’t, to the best of my knowledge, publish the data and adjustments used.
In essence, we are asked to accept NOAA’s version without being able to check or verify it.
Whatever the reason for the adjustments, the climate record for New York State has been changed out of all recognition, and bears no resemblance to the actual official data.
Global warming alarmism incorporates bits of science here and there to give it a veneer of plausibility, but mostly it is a combination of political bias and financial interest.
Notice: All comments are subject to moderation. Our comments are intended to be a forum for civil discourse bearing on the subject under discussion. Commenters who stray beyond the bounds of civility or employ what we deem gratuitous vulgarity in a comment — including, but not limited to, “s***,” “f***,” “a*******,” or one of their many variants — will be banned without further notice in the sole discretion of the site moderator.