Yesterday the state authorities attributed 20 new deaths to the COVID-19, bringing the total to 683. Seventeen of the 20 new deaths occurred among residents of long-term care facilities, bringing the total of LTC deaths to 554. The share of all such deaths now comes in a hair over 81 percent, by my calculation.
The age breakdown of the 20 new decedents follows the pattern we have observed to date. Of the 20 new decedents, one decedent was in his 100’s, three were in their 90’s, 10 were in their 80’s, one was in his 70’s, four were in their 60’s, and one was in his 50’s.
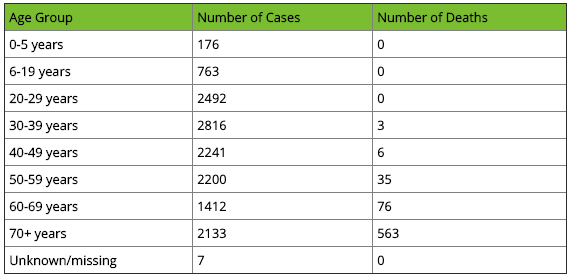
I have previously reported the median age of all decedents, which has remained stuck at 83 for weeks. The Department of Health’s Situation Update now omits this information. As of Wednesday afternoon, the median age of all decedents was 83.5. In lieu of the median age of decedents the Minnesota Department of Health Situation Update now provides a dropdown age group data table for all decedents (current version below).
We learned on Thursday that 98.8 percent of all deaths attributed to COVID-19 occurred among residents of long-term care facilities or others with serious underlying conditions (sometimes several of them). Per comments in the daily briefing yesterday (below), all such deaths are attributed to COVID-19.
If I were following the progress of the disease in Minnesota for the metropolitan daily newspaper that dominates the state, I would have a big story on the limited risk of fatality among healthy citizens. I would also want to highlight the subpopulations at risk of death on account of serious underlying medical conditions.
Unfortunately, that is not the way it is going down at the Star Tribune. Pulitzer Prize-winning Star tribune health reporter gets around to the 98.8 percent number in his story “Testing fuels Minnesota COVID-19 case surge; 808 new cases, 20 new deaths.”
The 98.8 percent number belies the campaign of fear that targets us in the headline of Olson’s story, but Olson buries it in the last paragraph: “COVID-19 continues to be harshest on the elderly and residents of long-term care facilities. Among all deaths, more than 98% involved people who were older or had underlying health conditions.” Even this is insufficiently fine-tuned; it should read “more than 98% involved people with underlying health conditions” or “more than 98% involved people with underlying health conditions in long-term care facilities and others with underlying health conditions.”
Olson has another story today as well. In “Unknown infection sources key to COVID-19 future in Minnesota” Olson notes that “as many as 80% of people with the infection suffer only mild symptoms” (I think this includes asymptomatic cases). You’d think this is a good thing, but it too supports the campaign of fear. Olson writes: “The trouble with such a high rate of mild or asymptomatic cases is that it allows for rapid spread of the virus, which has now been confirmed in all but three counties in Minnesota.”
In this story Olson also refers in passing to Minnesota Model 3.0: “the latest modeling this week predicted 1,441 deaths by the end of May under a scenario by which the statewide stay-at-home order ended on Monday” (see Scenario 6 on slide 14 of the state’s Power Point presentation on Minnesota Model 3.0).
Olson takes the model at face value, but it is a joke. The model was publicly released on Wednesday. I wrote about it in part 39. We have had 683 total deaths to date. To reach 1,441 deaths at the end of this month requires something like 47 deaths a day for the rest of the month. Yesterday we had 20; the day before we had 25. The highest so far is 30. I doubt that Minnesota Model 3.0 “predicts” the present, let alone the future. Kevin Roche has more here.
The University of Minnesota School of Public Health has posted Martha Coventry’s backgrounder on the Minnesota Model in “Modeling COVID-19 for Minnesota.” Coventry relates the projections on which Governor Walz premised his March 25 shutdown order: “One projection showed that cases would peak around April 26 in Minnesota if there were no mitigating steps to slow the virus. The death toll in this scenario could reach 74,000. The other scenario showed a time frame with significant and staged mitigations in place that pushed the peak to about June 29 and projected deaths in the 50,000–55,000 range.” Quotable quote (research assistant Marina Kinkeide): “Yes, numbers may look grim, but they are what we’re getting. You can’t argue with what you see.” Or what you don’t see, as the case may be.
I’m embedding the audio recording of yesterday’s daily press briefing by the Department of Health below. Toward the end of the briefing a reporter asked what percentage of the population has a serious underlying condition as defined. Vaguely citing a Kaiser Foundation analysis — probably the one referred to here — MDH Infectious Diseases Division Director Kris Ehresmann answered 30 percent. I don’t think this is right; the analysis includes all those age 65 or older in the at-risk group simply because “they are older.”
I take it that the authorities are rightly defensive about the statewide lockdown in the face of the 98.8 percent number. Unfortunately, however, they are not as defensive as they should be or would be if the facts were made clear.
Notice: All comments are subject to moderation. Our comments are intended to be a forum for civil discourse bearing on the subject under discussion. Commenters who stray beyond the bounds of civility or employ what we deem gratuitous vulgarity in a comment — including, but not limited to, “s***,” “f***,” “a*******,” or one of their many variants — will be banned without further notice in the sole discretion of the site moderator.