In the never-ending saga of Dr. Fauci’s white-coat supremacism over public policy, in which, to paraphrase Mussolini, the motto of Faucism might be “All within the CDC, nothing outside the CDC, nothing against the CDC,” we note the new study from MIT published in the Proceedings of the National Academy of Sciences which finds that the indoor six-foot distancing rule is not well-founded. To the contrary, the study found that there was about the same risk of catching COVID indoors at 60 feet as there is at six feet. Face masks and ventilation/air circulation are much more effective than social distancing.
The full study is very technical, but the authors offered this plain-English summary to CNBC:
“We argue there really isn’t much of a benefit to the 6-foot rule, especially when people are wearing masks,” Bazant said in an interview. “It really has no physical basis because the air a person is breathing while wearing a mask tends to rise and comes down elsewhere in the room so you’re more exposed to the average background than you are to a person at a distance.”
Meanwhile, the New York Times has a story out Friday purporting to prove that the U.S. death rate is the highest in a century because of COVID. The article is a case-study in the importance of statistical presentation—especially when put into graphic form. The first chart in the article seems to back up the headline:
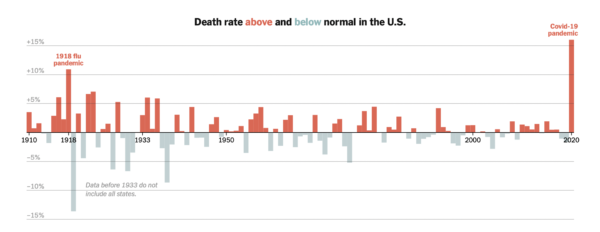
WOW! Look at the 2020 spike! We’re all doomed! Thank God for Dr. Fauci!
But the matter begins to look different when you look at the second chart the Times included:
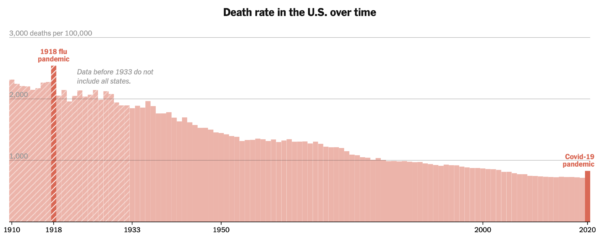 Let this sink in a minute: the-long-term trend in the U.S. death rate has been steadily down, by more than 50 percent since the Spanish Flu of 1918. The “normal” in the first chart is a moving target, but they have flatlined the x-axis for a relative trend. This is the kind of thing some media fact-checkers might call “deceptive.”
COVID has indeed generated a noticeable spike in the death rate, moving us back to the death rate of about . . . the year 2000. However, given that COVID fatalities are skewed toward the elderly, as unfeeling as it may sound, COVID partially represents an acceleration of imminent mortality. We see this phenomenon every now and then when a heat wave or cold snap results in a high number of deaths especially among the elderly in a major metropolitan area, and over the next year the overall death rate for the elderly reverts to the mean or actually declines below normal for a year or so.
Look again at the 1918 Flu bar in the chart above, and you notice the death rate drops considerably below the pre-pandemic level the following year (1920). The same thing is likely to happen to our death rate from COVID once it is finally over with.
The Times gives away their statistical illiteracy in this paragraph:
Combined with deaths in the first few months of this year, Covid-19 has now claimed more than half a million lives in the United States. The total number of Covid-19 deaths so far is on track to surpass the toll of the 1918 pandemic, which killed an estimated 675,000 nationwide.
Spot the sloppiness here? The U.S. population in 1918 was about one-third what it is today, which means 657,000 fatalities is way higher than the death rate from COVID today. In other words, the U.S. has become much more robust and resilient over the last century, such that even with obesity and a demographic bulge of of vulnerable elderly, our death rate today is comparatively low. If we had the same death rate as 1918, we’d be on our way to 1.5 million COVID deaths.
Notice: All comments are subject to moderation. Our comments are intended to be a forum for civil discourse bearing on the subject under discussion. Commenters who stray beyond the bounds of civility or employ what we deem gratuitous vulgarity in a comment — including, but not limited to, “s***,” “f***,” “a*******,” or one of their many variants — will be banned without further notice in the sole discretion of the site moderator.