The New York Times has a crew of computer graphics geeks who love to put together lots of novel and interactive features that no other newspaper can do. Usually they are a chore to use, but yesterday they put up a nifty map that dramatizes just how badly Democrats lost votes in their biggest strongholds—deep blue metro areas—and among their strongest voting demographics, mainly lower middle income, working class, and minority voters.
Each of the pairs below displays the blue-red vote share for 2024 on the left, which shows that Democrats easily held their strongholds; but the chart on the right shows how much the various neighborhoods and towns shifted to Trump in 2024 over 2020—the deeper the red, the larger the shift. Let’s start with the greater Los Angeles area (you may wish to click to enlarge):
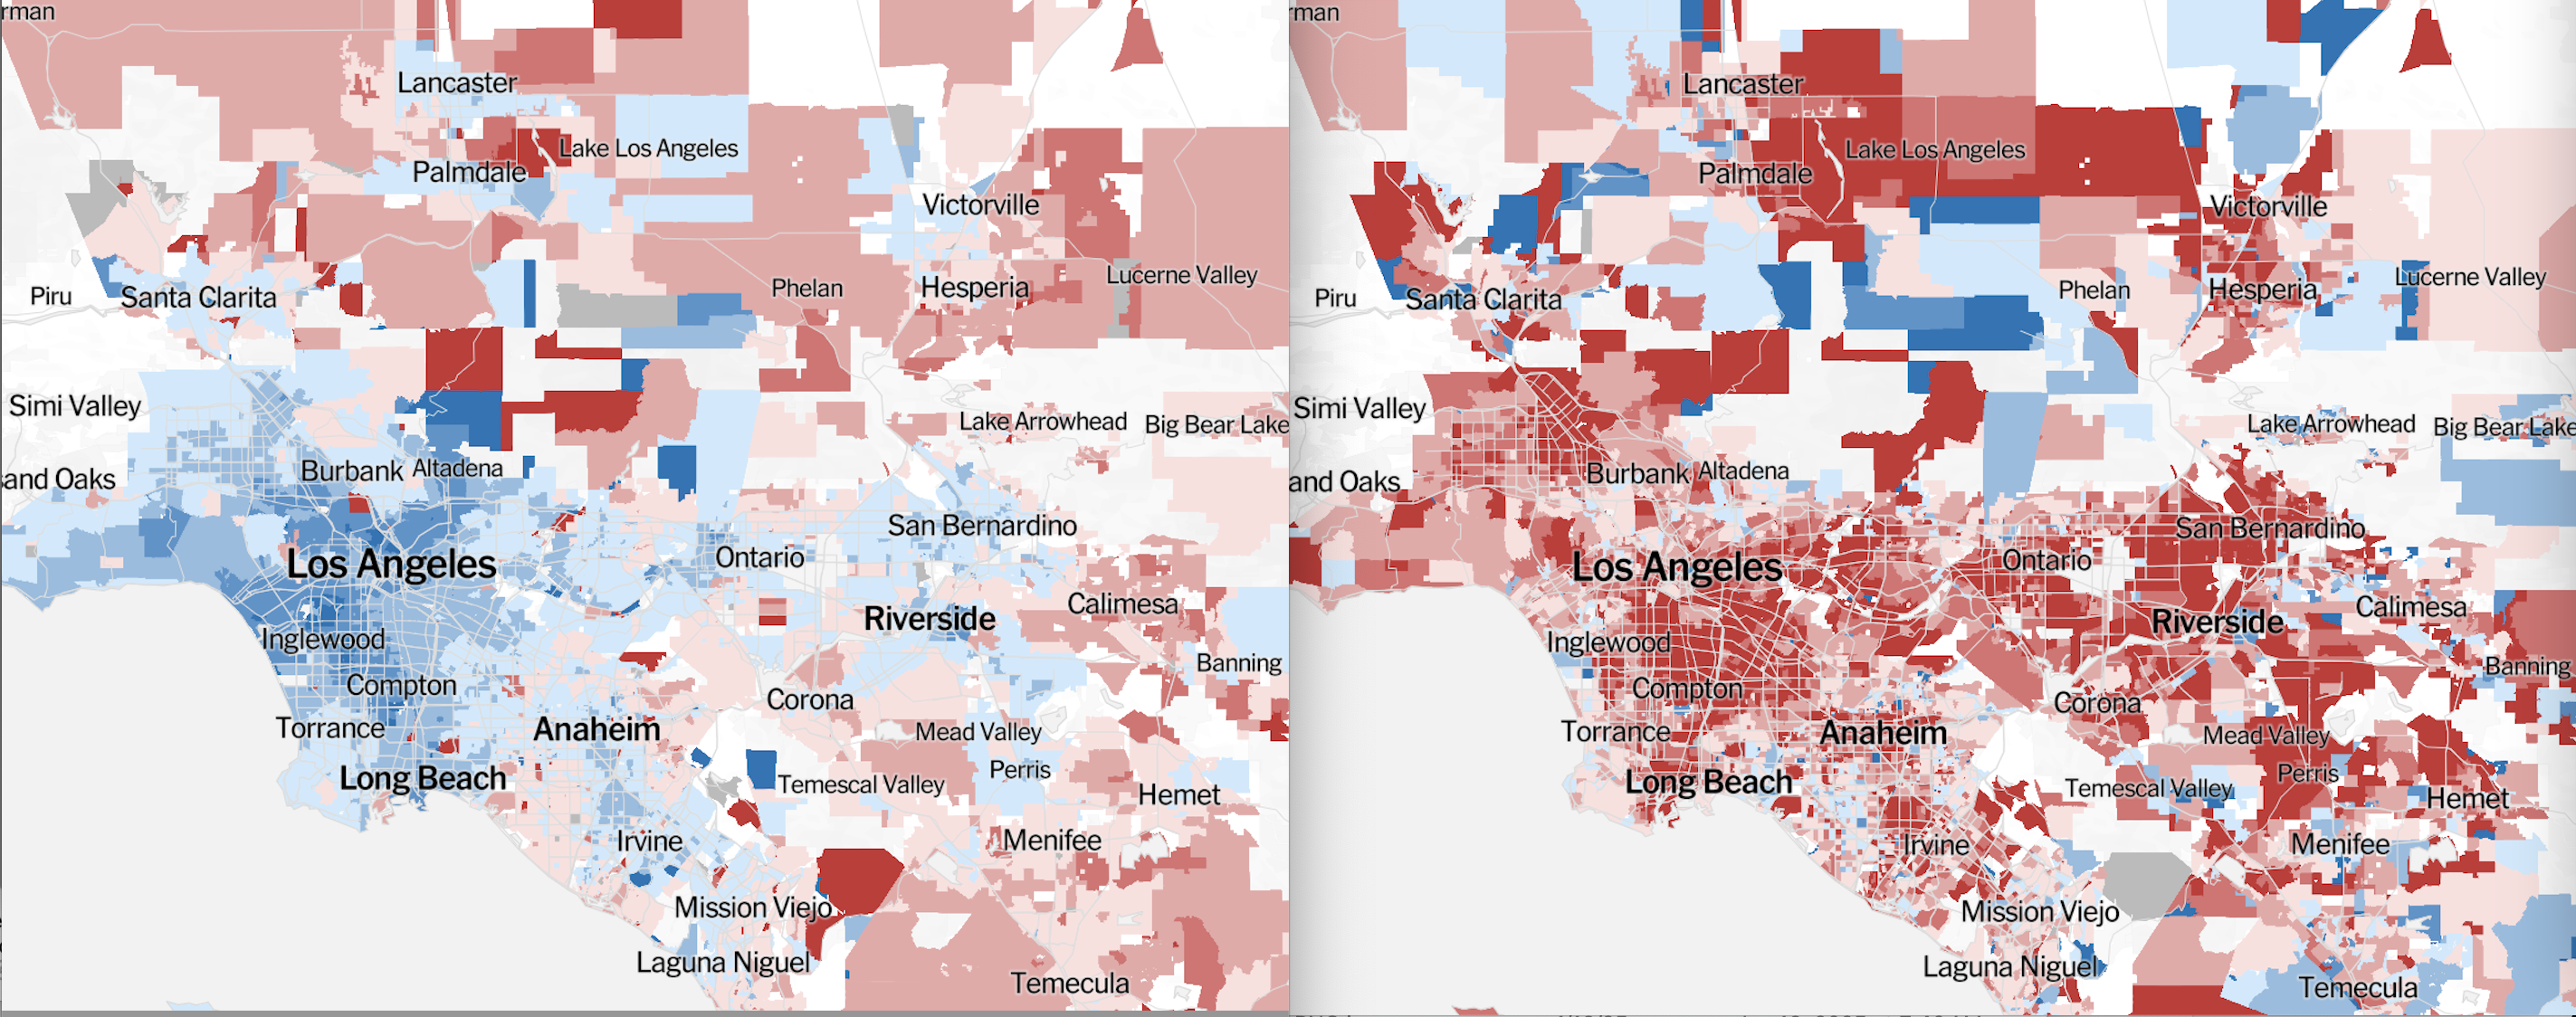
The deepest red areas on the right are NOT areas where Republicans ever do well. Same thing in the Bay Area:
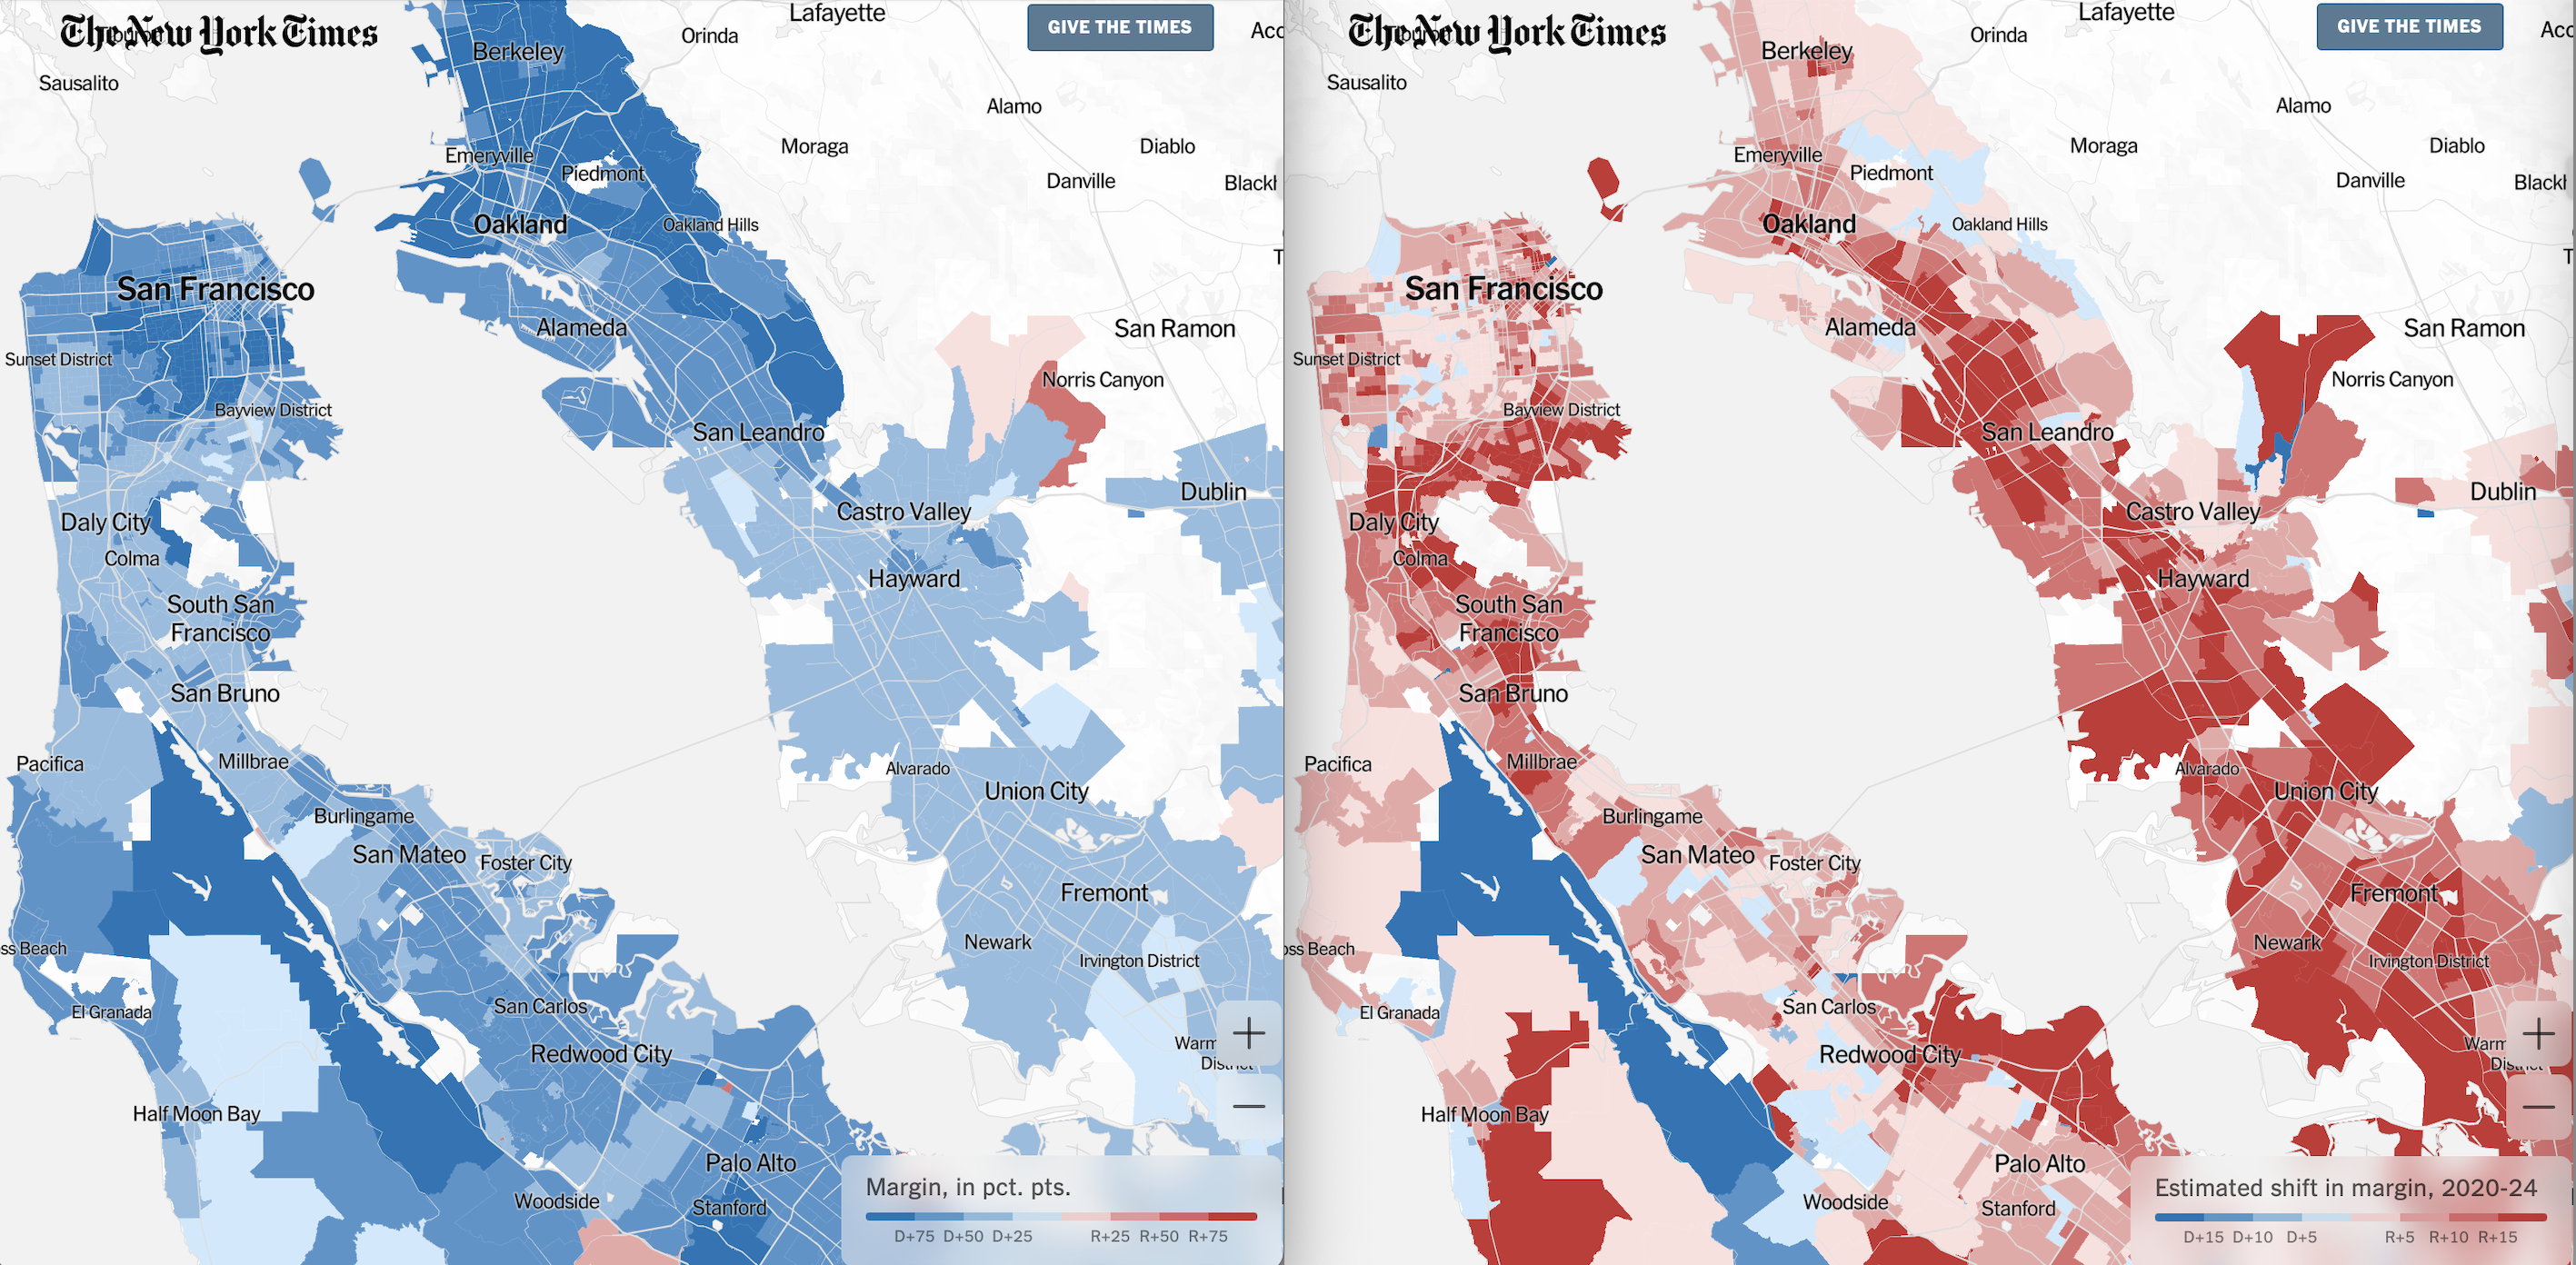
Same pattern: areas with high crime rates, especially in the East Bay, shifted the most.
Finally, greater New York City:

These kind of shifts ought to terrify Democrats.