The Daily Chart: Updates Edition

This installment is an update on two recent TDC items: what the yield curve is trying to tell us, and perspectives on California rainfall.

My chart in “Carville’s Ghost” was a little hard to make out, but this new one from Apollo Academy is much more clear on how anomalous the current interest rate cycle is:

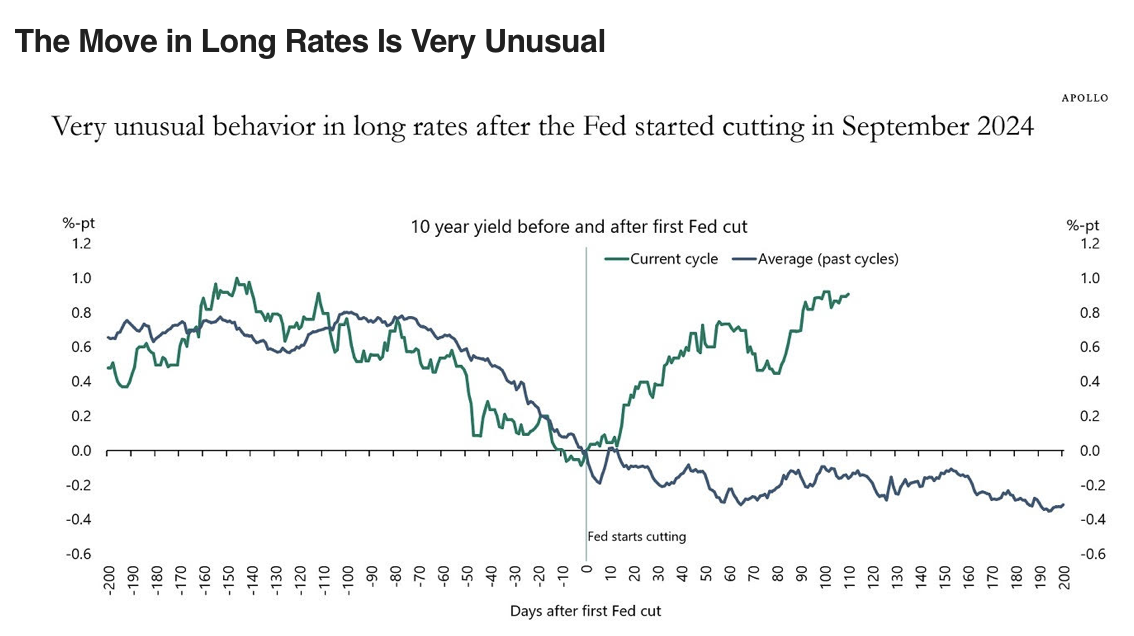
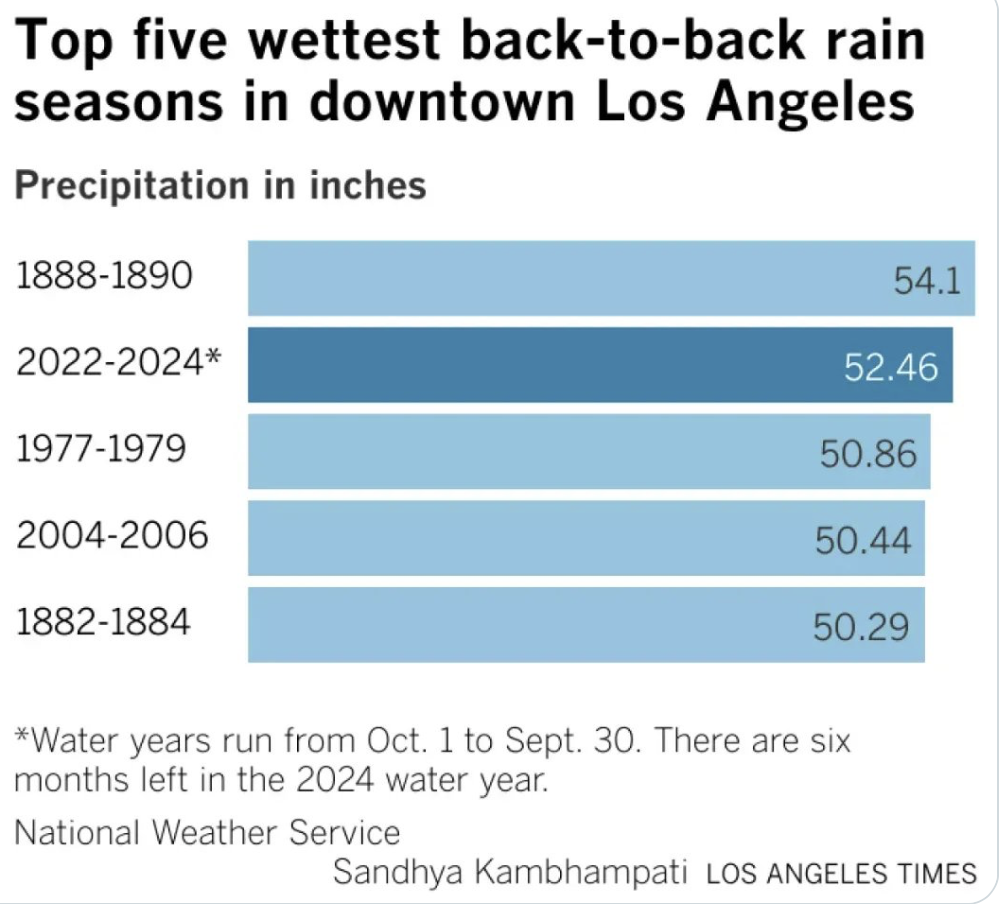
Meanwhile, when it comes to rain in California, here’s another look at rain in just LA:


Notice: All comments are subject to moderation. Our comments are intended to be a forum for civil discourse bearing on the subject under discussion. Commenters who stray beyond the bounds of civility or employ what we deem gratuitous vulgarity in a comment — including, but not limited to, “s***,” “f***,” “a*******,” or one of their many variants — will be banned without further notice in the sole discretion of the site moderator.

Responses