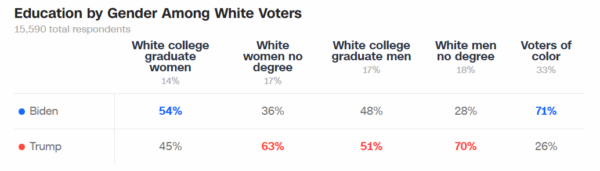
• Up first: Anti-Semitism. Everyone knows the great historical riddle: how could Germany, the most educated nation in Europe, fall into such a vicious anti-Semitic frenzy? Thank goodness it could never happen here. Oh, wait—turns out the more education you have in the U.S., the more likely you are to support authoritarian measures against faithful Jews. But BLM? Riot on, man!
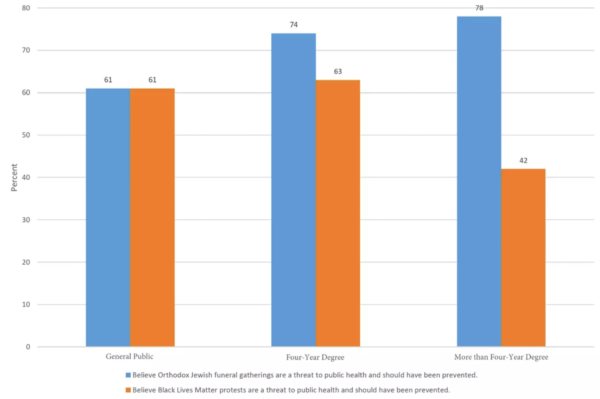
Pretty sure we should be closing down graduate schools if we’re worried about bigotry and extremism. More at Tablet magazine.
• While we’re on the subject of religion this Easter week, we’re told that the country is becoming more secular, and shown this Gallup time series.
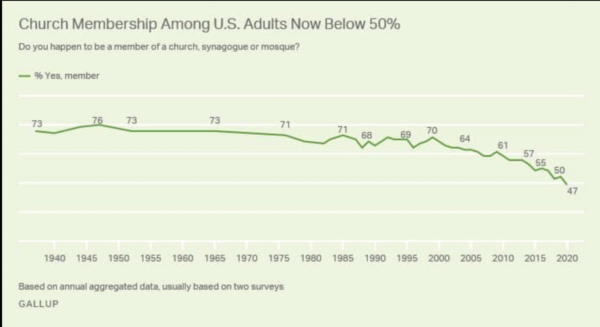
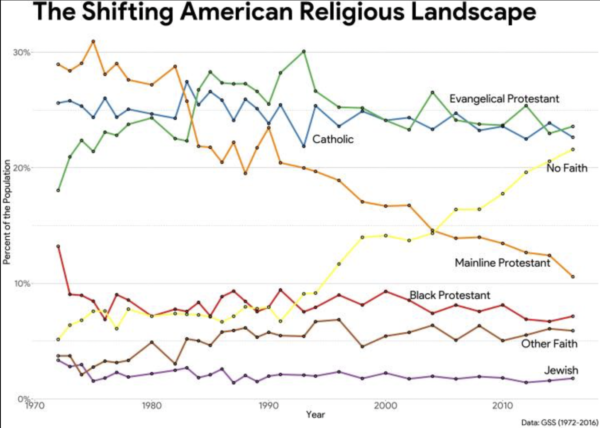
But here’s the thing: the decline in church attendance is heavily skewed to so-called “mainline” denominations that have one big thing in common: they’ve been overrun by the left in most cases. The Catholic church and evangelical denominations have seen much less decline in attendance over the last 50 years:
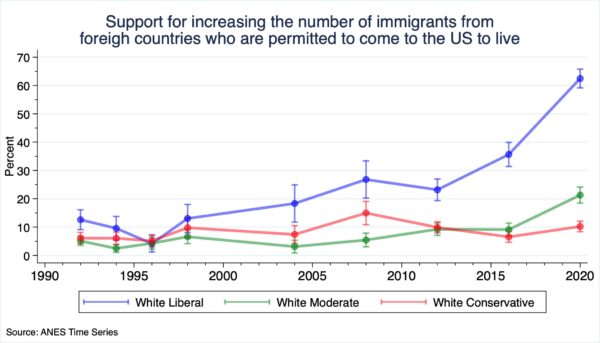
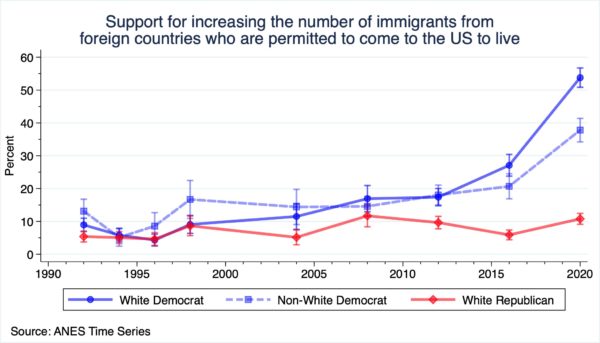
• Zach Goldberg strikes again. What these two charts show is that support for increased immigration has soared among liberals in recent years—especially white liberal Democrats.
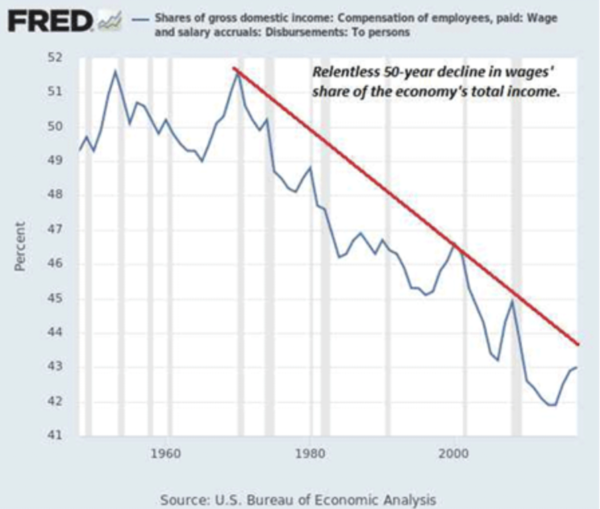
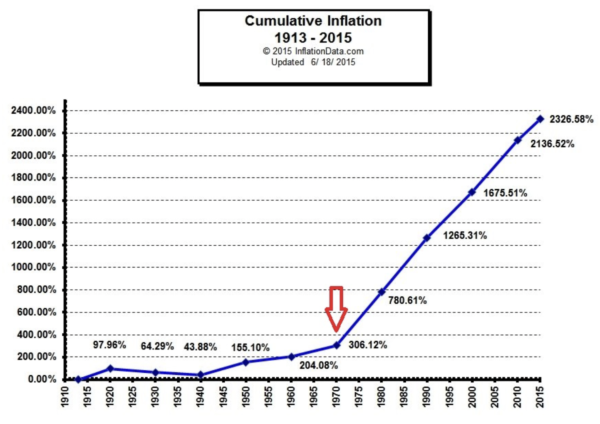
• What happened in 1971? As you probably know, the left has been hopped up for a while now on income inequality, along with the related claim that middle class wages have stagnated since the early 1970s, after having risen steadily in the first two post-war decades. The left likes to blame this on tax cuts, but the supply-side revolution doesn’t get going until the late 1970s and early 1980s. Yet 1971 appears to be the inflection point. Why? Investor John Mauldin has a nice slide deck going through aspects of the date; here are a few highlights from it:
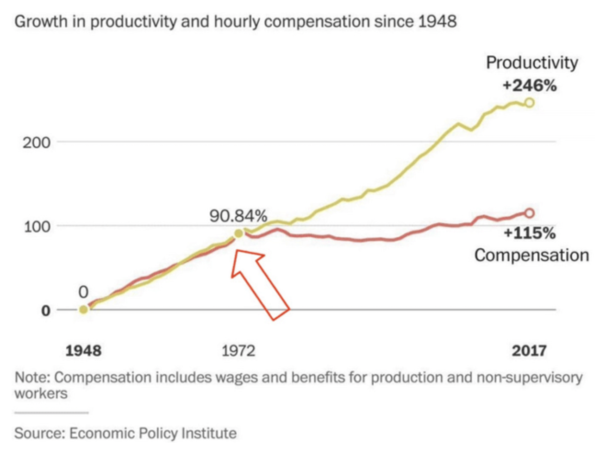
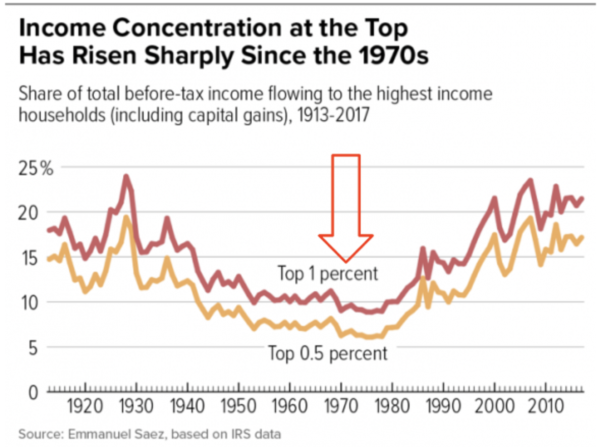
Note: This chart is almost surely wrong or misleading, but as it is in wide circulation you should know about it.
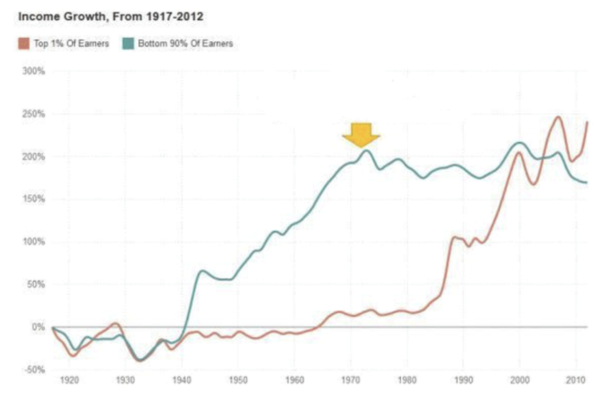
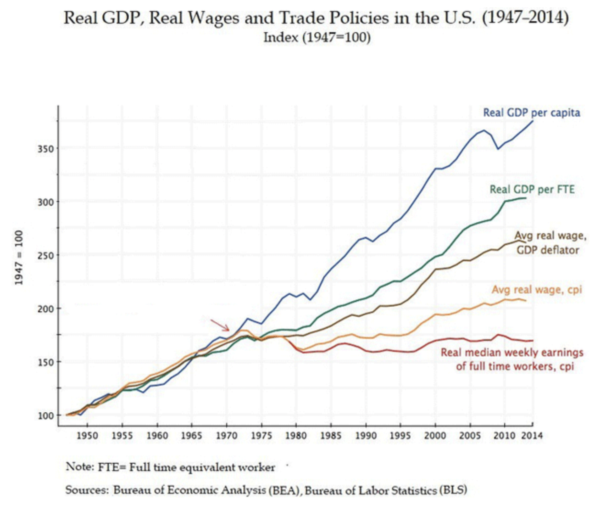
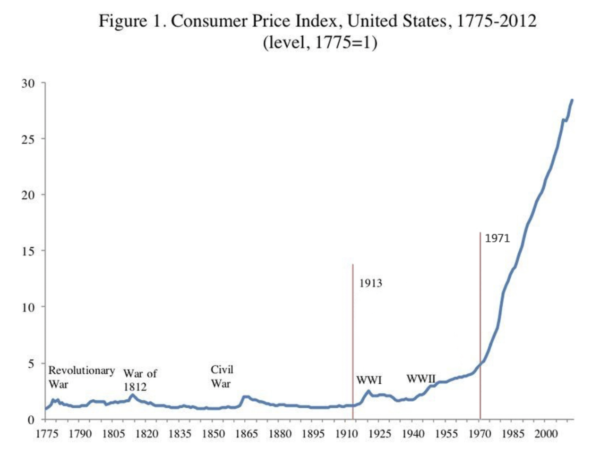
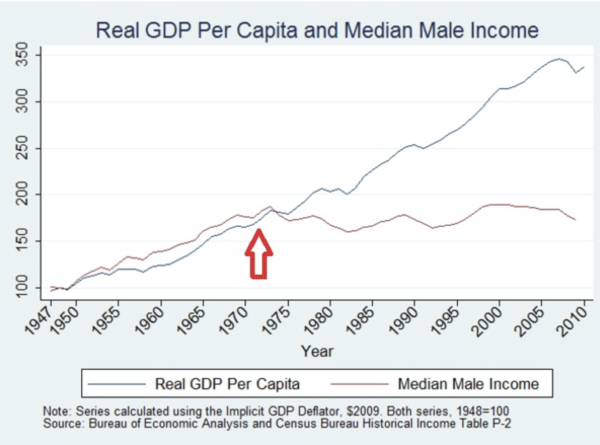
One thing we know that happened in 1971 is that the U.S. went off the gold standard. Might that have anything to do with trends? The before and after charts sure look it meant something:
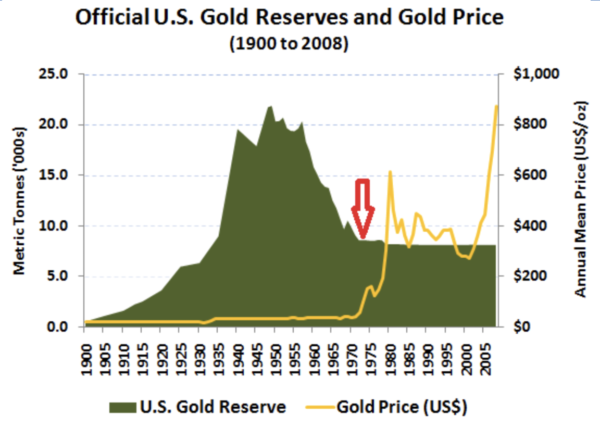
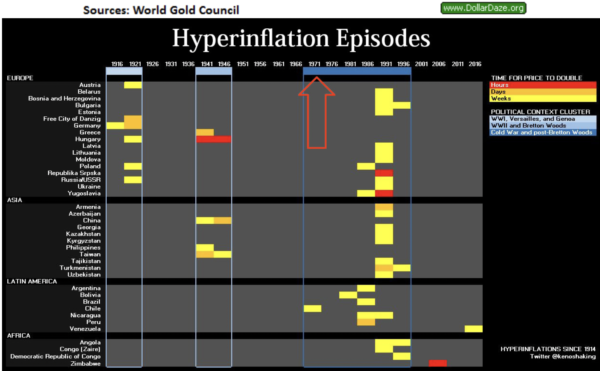
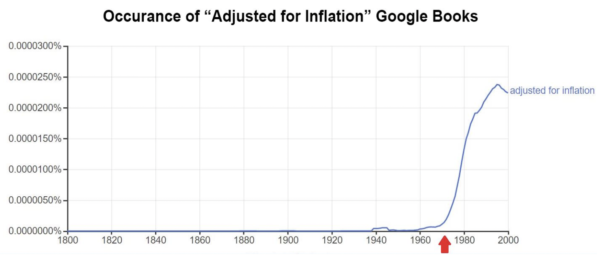
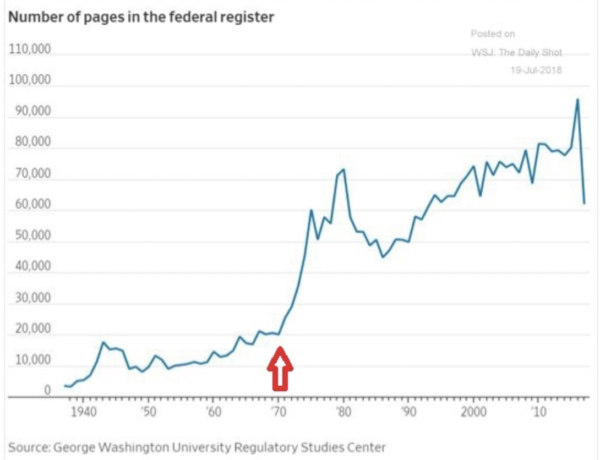
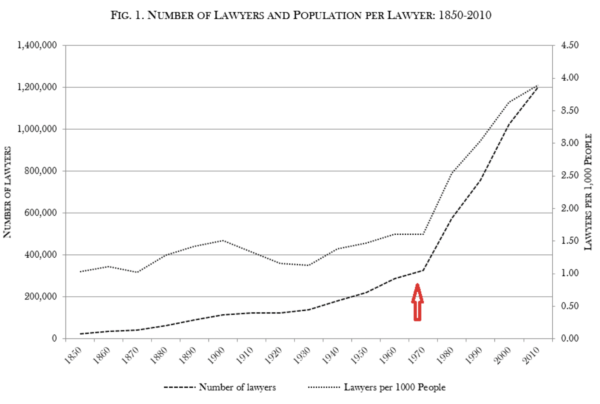
Are these inflections occurring after we abandoned the gold link purely coincidental? Maybe. Because there are other factors that also coincide roughly with 1971. Like the explosion in regulation, which increased the capital cost for each new job generated, which in turn put downward pressure on basic labor wages:
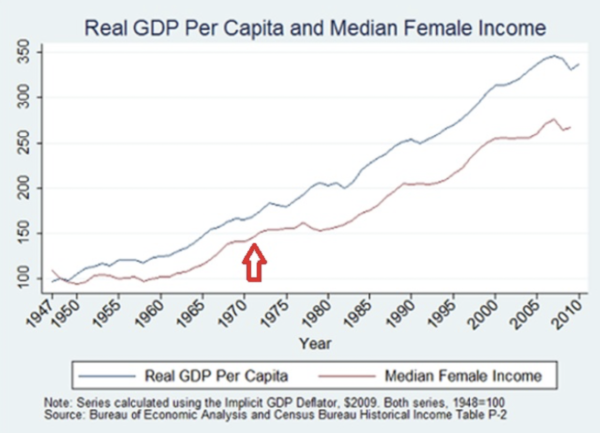
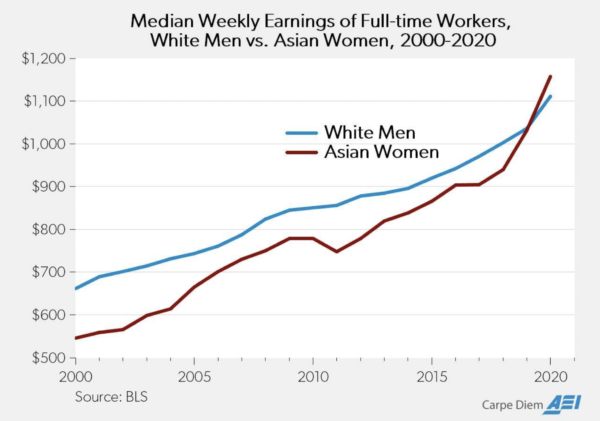
What else happened around 1970? Women started entering the workforce in much larger numbers. Compare these next two charts, which show a considerable gender gap in wage trends:
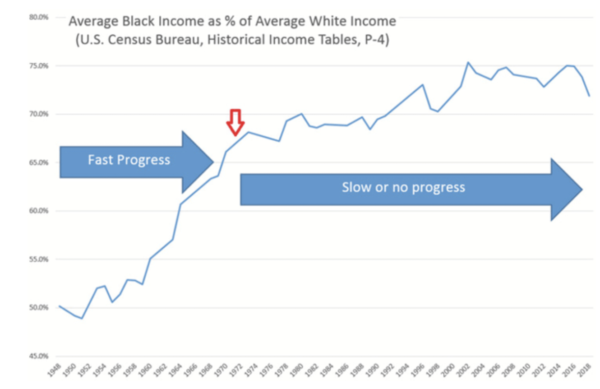
Black income was also rising steadily until about 1970, then stopped. Is there any relationship between this and the changing overall composition of the labor force, not with more women, but also higher rates of immigration that started in the late 1960s? These are questions that labor economists resolutely avoid exploring. Gee, I wonder why?
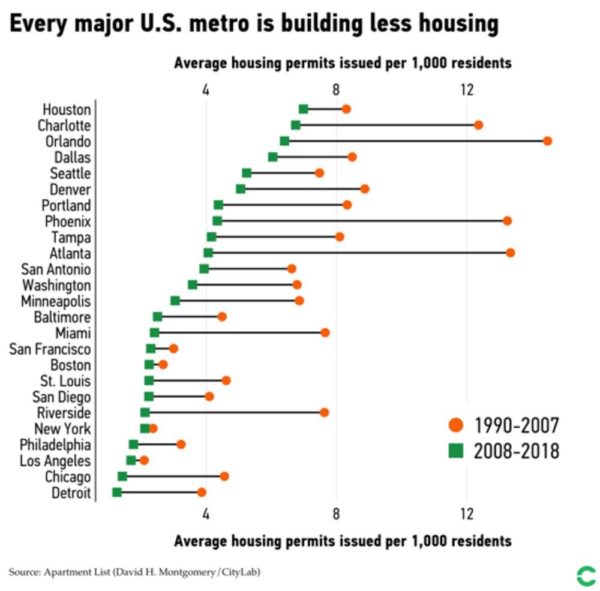
Meanwhile, Mark Perry strikes again:
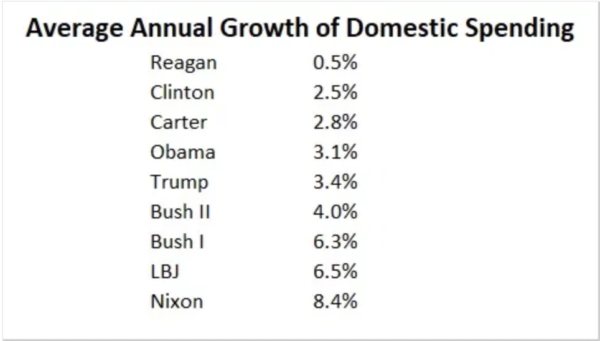
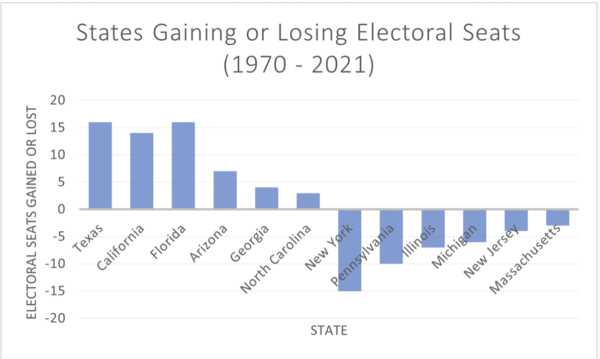
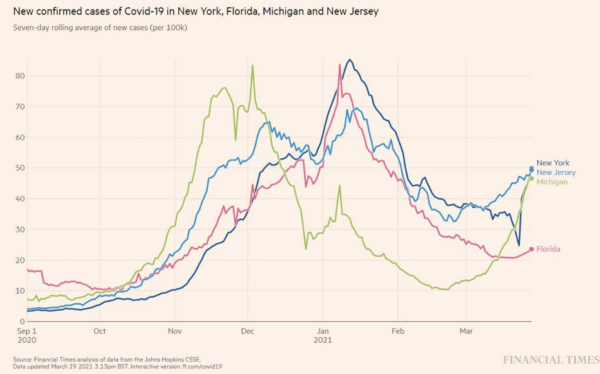
• Lastly, a few stray charts for you to interpret on your own.

And finally. . .