This study by Phil Kerpen of the Committee to Unleash Prosperity, Casey Mulligan of the University of Chicago’s Department of Economics, and Stephen Moore of The Heritage Foundation is getting a lot of attention. The authors seek to evaluate and to rank the 50 states and D.C. on their responses to the covid epidemic. The study takes into account both economic and health criteria:
Our measures fall into three categories: the economy, education, and mortality. For economic performance we used two measures: unemployment and GDP by state. For education we used a single metric: the Burbio cumulative in-person instruction percentage for the complete 2020-2021 school year, with hybrid instruction weighted half. For mortality we used two measures: COVID-associated deaths reported to the CDC and all-cause excess mortality.
The authors made various adjustments in order to equalize ratings among states:
[B]ecause the pandemic had a much more negative effect on economic output in some industries (such as entertainment, energy production, mining, hotels and food), we adjust unemployment and GDP changes for industry composition. We adjust COVID mortality (through March 5, 2022) for age and “metabolic health,” by which we mean the pre-pandemic prevalence of obesity and diabetes – as these are highly correlated with higher death rates from the virus.
The authors find a strong correlation between economic and education outcomes, suggesting that the states that fared the best economically were generally also the ones that kept their schools open. No surprise there. Covid decisions have often been seen as involving a tradeoff between health concerns and the economy, but the authors don’t see evidence of such tradeoffs:
The correlation between health and economy scores is essentially zero, which suggests that states that withdrew the most from economic activity did not significantly improve health by doing so.
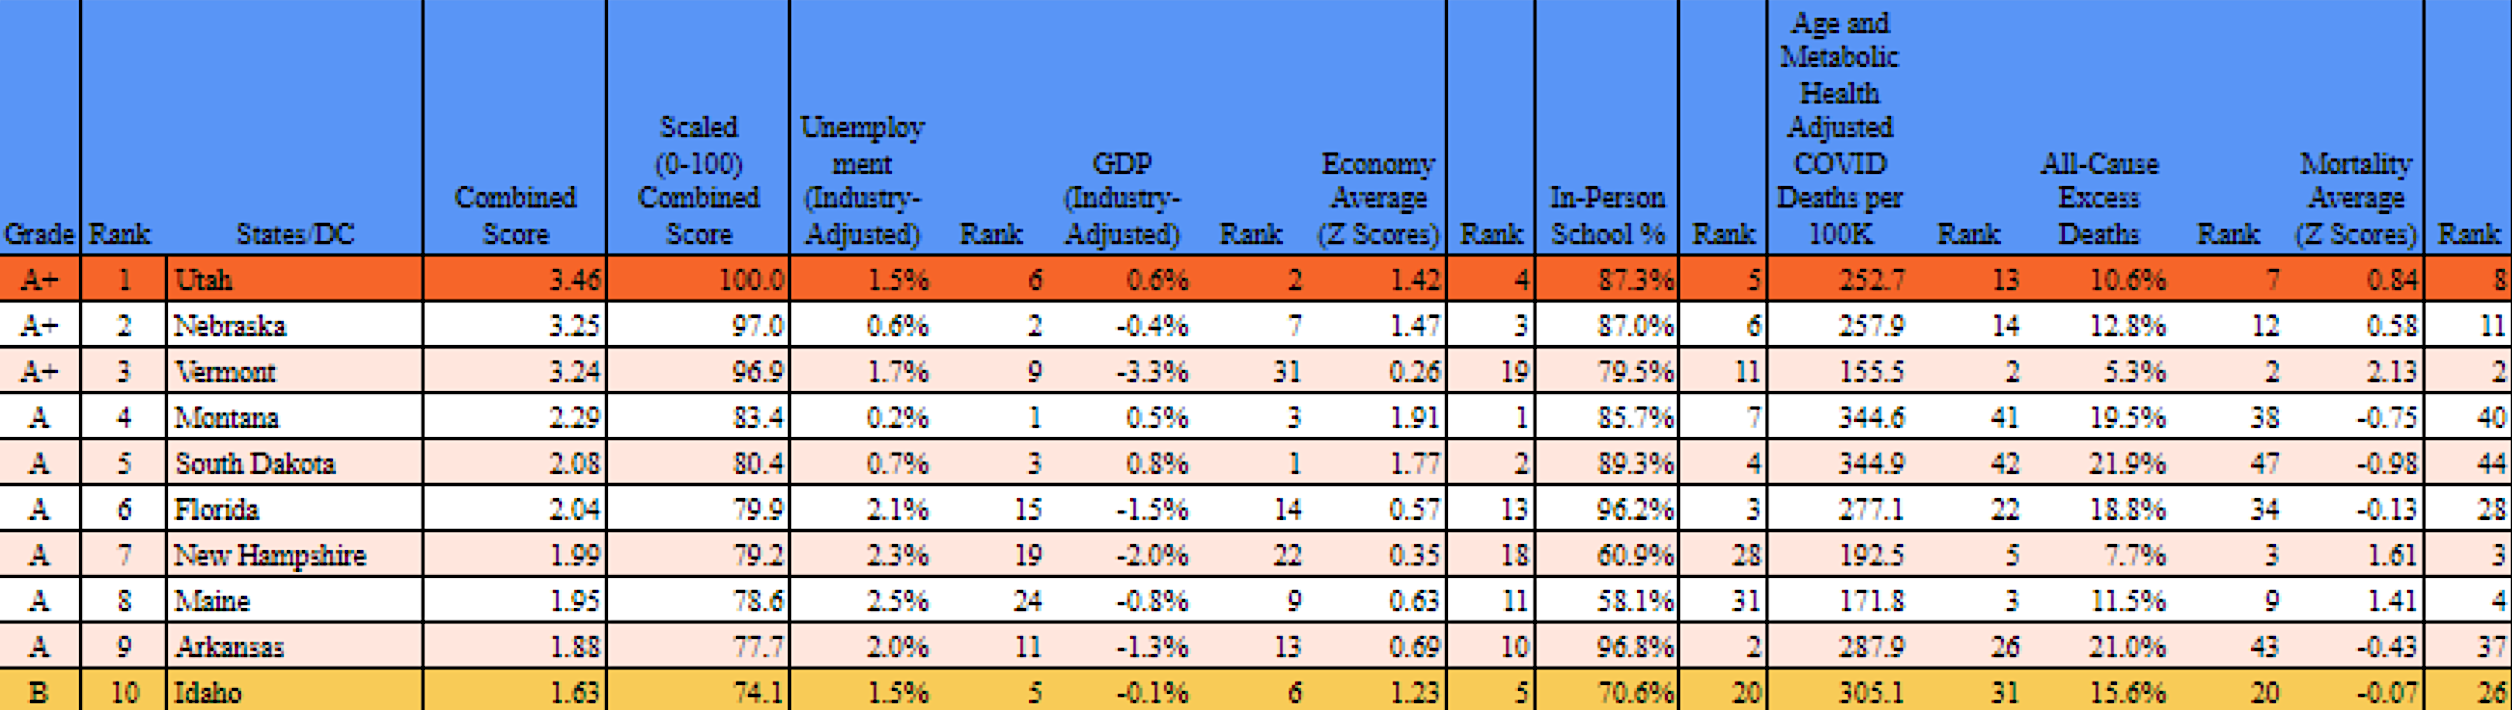
The study is embedded below. It includes a lot of data which you can peruse at your leisure. The authors conclude that generally it was the conservative states that did the best, and the liberal states that did the worst. This screen shot shows the top ten rated states and their scores on the various metrics; click to enlarge:
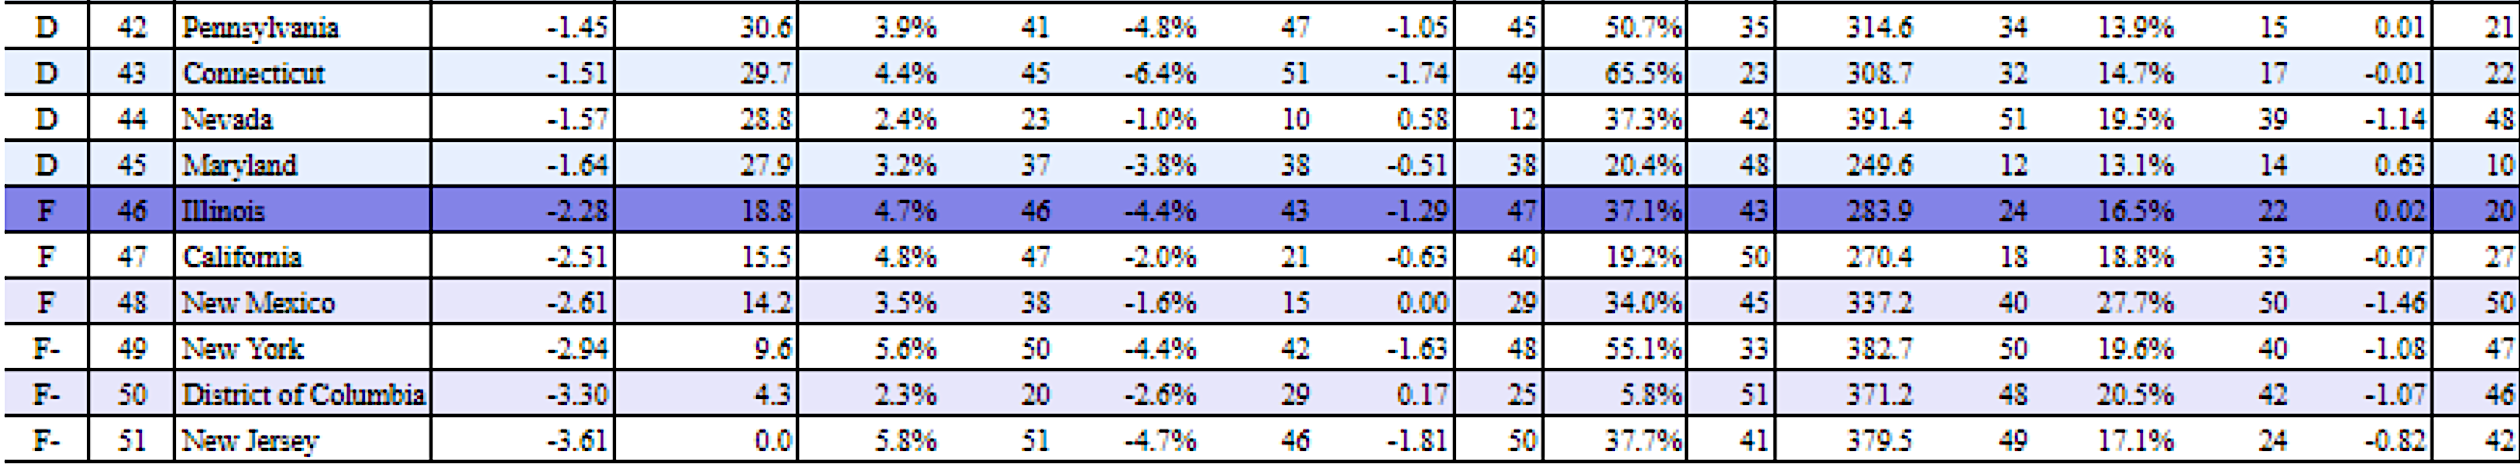
This screen shot shows the bottom 10:
The authors note that there are some regional correlations, but that some states stand out within their regions:
The outcomes in NJ, NY, and CA were among the worst in all three categories: morality, economy, and schooling. UT, NE, and VT were leaders in all three categories. The scores have a clear spatial pattern, perhaps reflecting spatial correlations in demographic, economic, and political variables. However, IL, NM, CO, and CA are outliers among their geographic neighbors in the direction of low combined scores. FL, AR, WV, and UT are outliers in the other direction.
I think “morality” in that quote was intended to be mortality, but maybe it was a Freudian slip.
The authors of this analysis are conservatives, and their conclusions no doubt will be rejected by liberals. For one thing, many liberals will object to weighing economic well-being against mortality, even though if one is thinking clearly one often does this in assessing policy choices. But in any event, the data are there, and they are hard to argue with.
Here is the paper:
[scribd id=569583154 key=key-42YFiNuuQ1wIiRbQaVaa mode=scroll]