One of my failings and regrets is not getting to know Pat Michaels better. Pat’s passing about 10 days ago, at the too early age of 72, ago shocked his many friends. I met him several times and knew his work, and we once had a long and very convivial evening together in a New York bar about 15 years back. But I didn’t keep up with him as I should have, even though he was one of the premier climate change analysts of our time, ceaselessly toiling to debunk the exaggerations and errors of the so-called “consensus” about climate change.
Someone who knew him well and followed his work closely is our friend Ben Zycher of AEI (who is one of my go-to persons on climate and energy economics), and I asked Ben if he’d work up a proper tribute to Michael for Power Line. Here’s Ben (complete with footnotes!—so this is more than an obituary; it is also a reference work):
“Denier.” “Tool of the oil producers.” “Facilitator of planetary destruction.” Such were among the more moderate epithets directed at Pat Michaels, a real climatologist: Ph.D. from the University of Wisconsin, former president of the American Association of State Climatologists, former program chairman for the Committee on Applied Climatology of the American Meteorological Society, for thirty years a Research Professor of Environmental Sciences at the University of Virginia, and the state climatologist of Virginia for 27 years.
Pat published numerous papers in the peer-reviewed scientific journals; I have not taken the time to count them, but Chip Knappenberger reports that he and Pat “co-authored 25+ papers on climate and climate change published in the peer-reviewed scientific literature, penned hundreds of articles in the popular media, [and] countless blog pieces.”[1] Needless to say, Pat published a lot more either alone or with other co-authors.
Pat published nine books, the most important of which in my view is Lukewarming: The New Climate Science That Changes Everything, co-authored with Knappenberger (Cato Institute, 2016). I believe it to be one of the five or thereabouts most important books on climate science and policy published in the last 30 years. In a nutshell: Anthropogenic climate change is “real” but vastly less important than commonly asserted. The mainstream climate models cannot predict the past or the present, and therefore are a highly unreliable guide for the future. The scientists that write the various working-group papers that together make up the periodic assessment reports from the Intergovernmental Panel on Climate Change to a significant degree are engaged in self-delusion, in no small part because they are exceedingly poor statisticians who, perhaps shockingly, do not understand the difference between drawing an observation out of a possibly-fat tail of a statistical distribution, versus a shift of the entire distribution.
Pat’s work showed that there is no evidence in support of the crisis narrative, about which more below. He made the point, obvious but usually ignored, that any evaluation of climate policy proposals should include the benefits of increasing atmospheric concentrations of greenhouse gases, among which are planetary greening, increased agricultural productivity, improved water use efficiency by plants, reductions in mortality from cold (vastly greater than heat-related mortality), longer growing seasons (for the U.S., it has increased by about two weeks since 1970.[2]
In a word, Pat’s work was comprehensive. I am but a lowly economist, and the central difference between economists and real scientists is straightforward: The latter actually have to know something. And so my intellectual debt to Pat is enormous, as I knew virtually nothing about climate science — despite decades of work on energy and environmental policy — until I began to interact with Pat. His collegiality, patience, invincible humor, objectivity, and supremely impressive stock of knowledge were tremendous assets in terms of my own intellectual development in this area.
My intellectual debt to Pat is one that defies satisfaction. I offer here a brief summary of the evidence on climate phenomena, as I know of no better way to honor Pat’s memory, and I believe that Powerline readers may find this of interest.
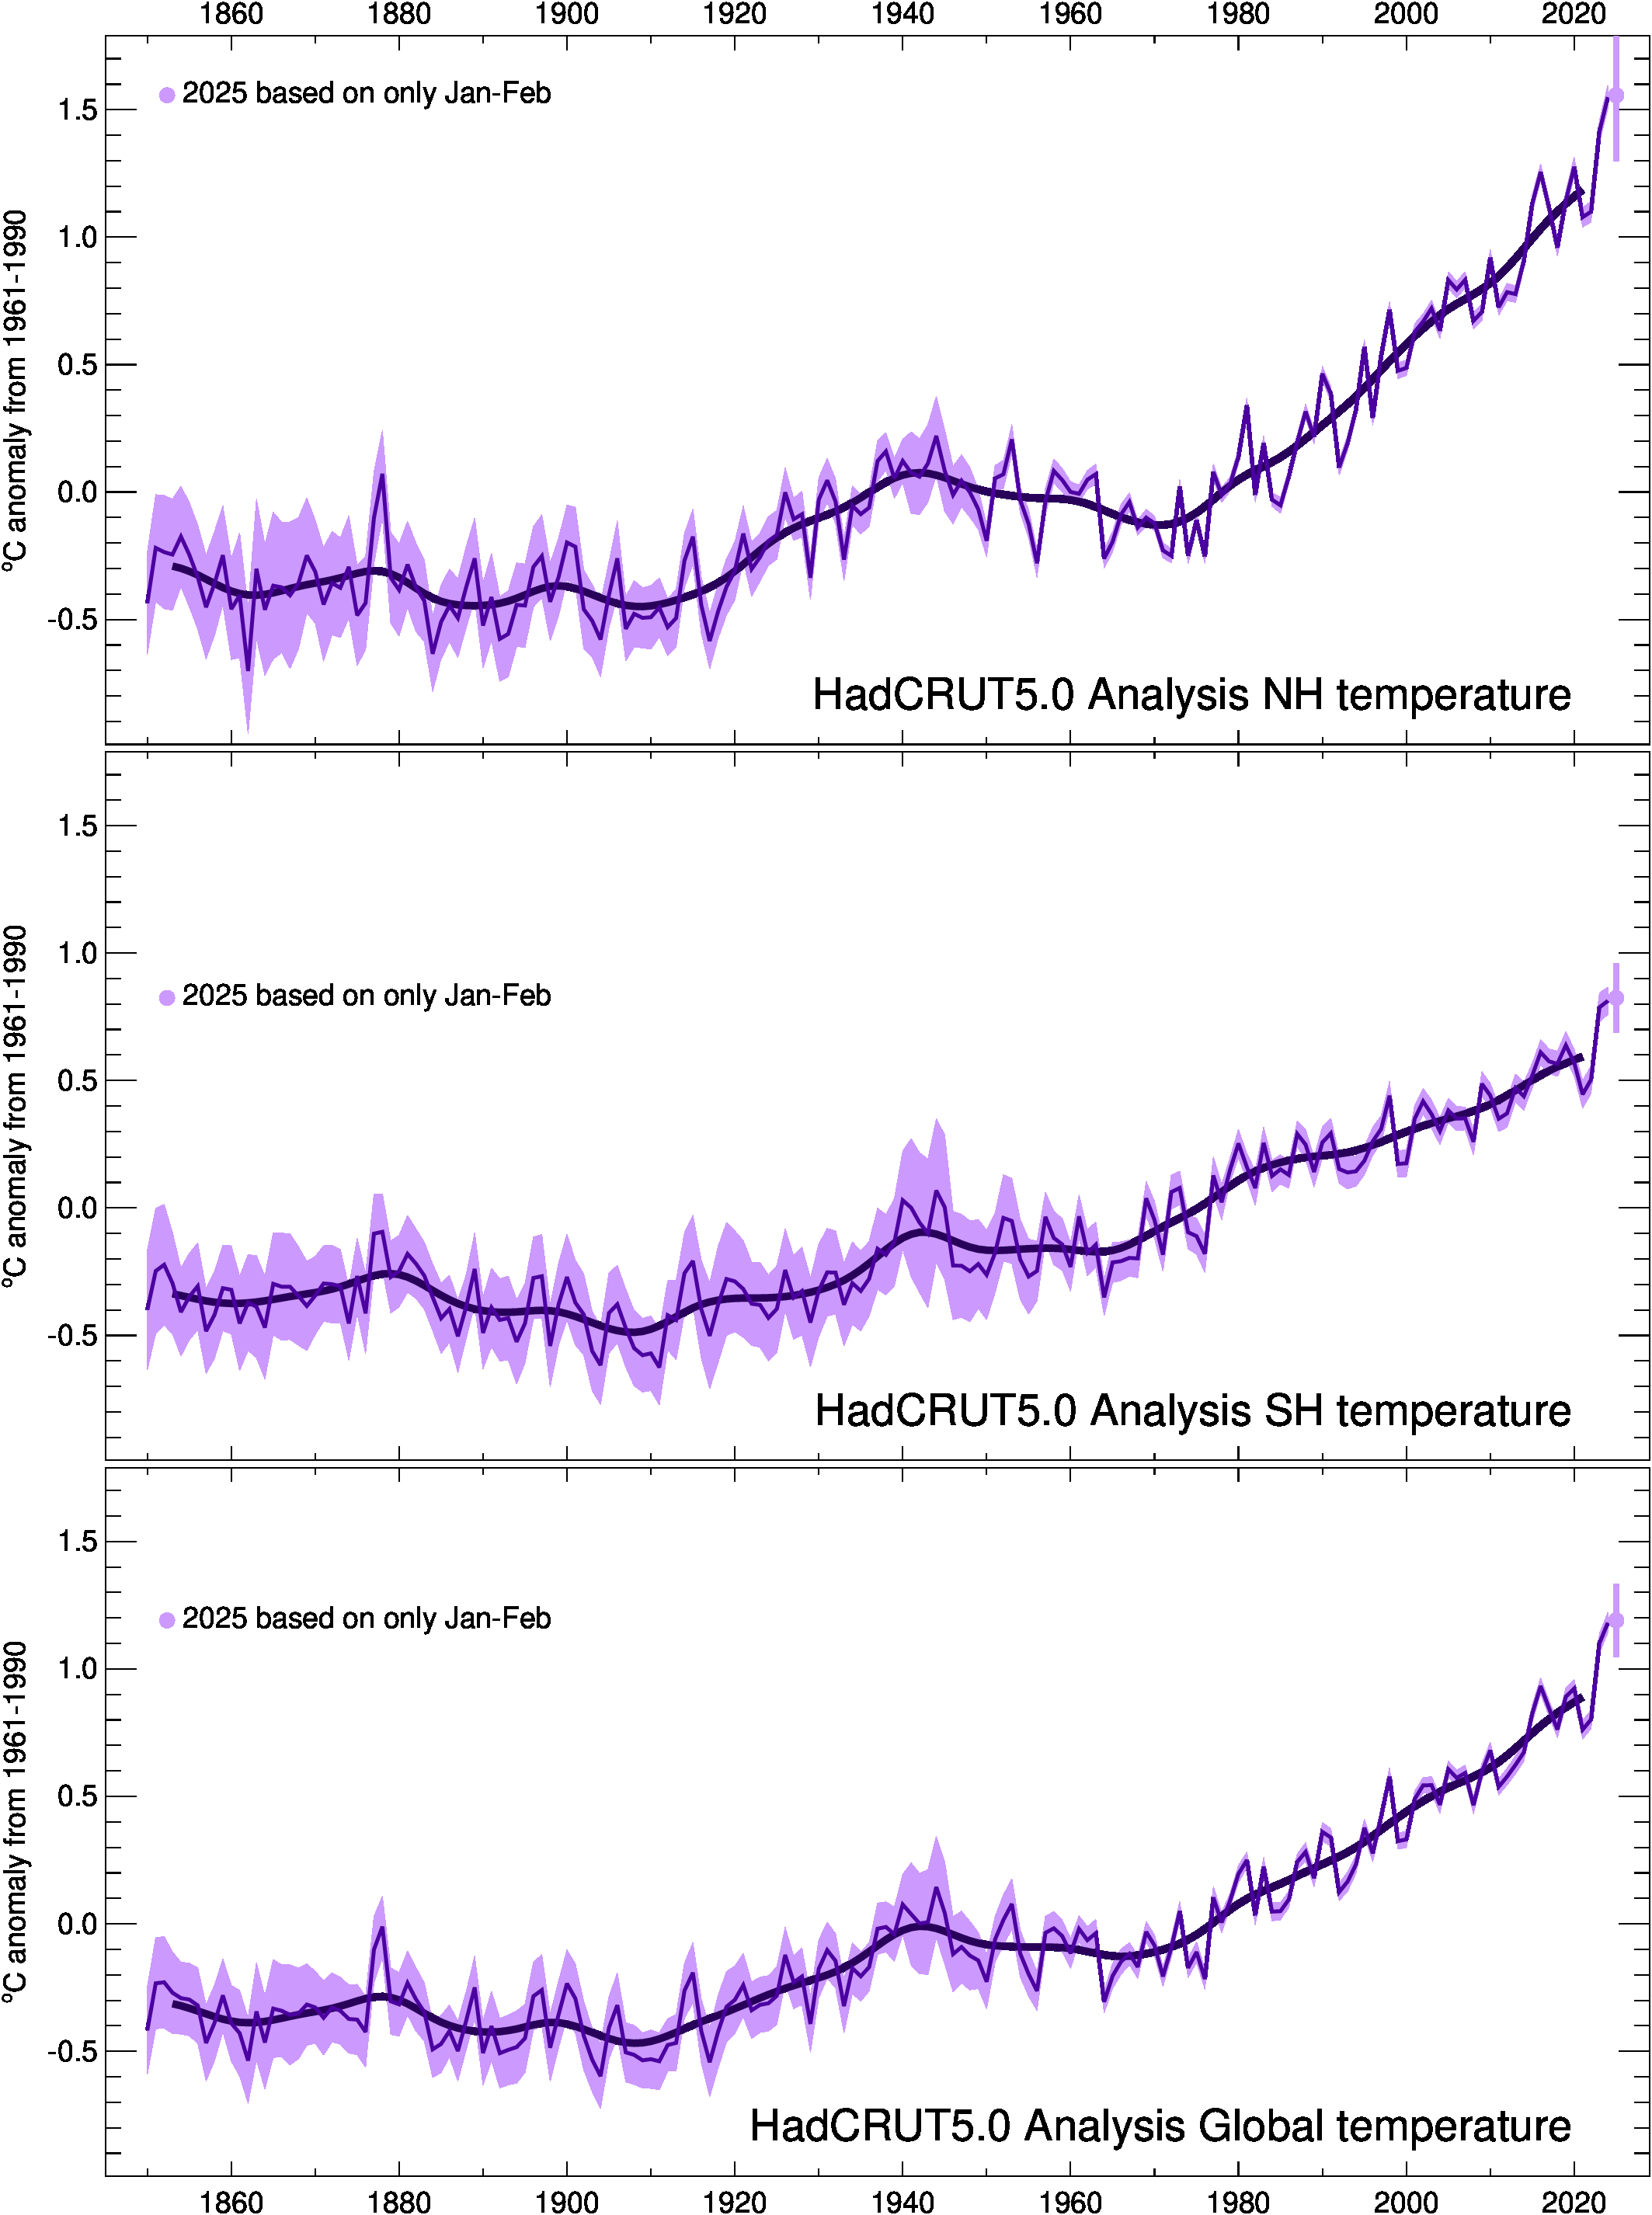
That anthropogenic climate change is “real” — that increasing GHG concentrations are having detectable effects — is incontrovertible, but that does not tell us the magnitude of the observable impacts, which must be measured empirically. Temperatures are rising, but as the Little Ice Age ended no later than 1850, it is not easy to separate natural from anthropogenic effects on temperatures and other climate phenomena.[3] The latest research in the peer-reviewed literature suggests that mankind is responsible for about half of the approximate temperature increase of 1.1 degrees C since 1880.[4]
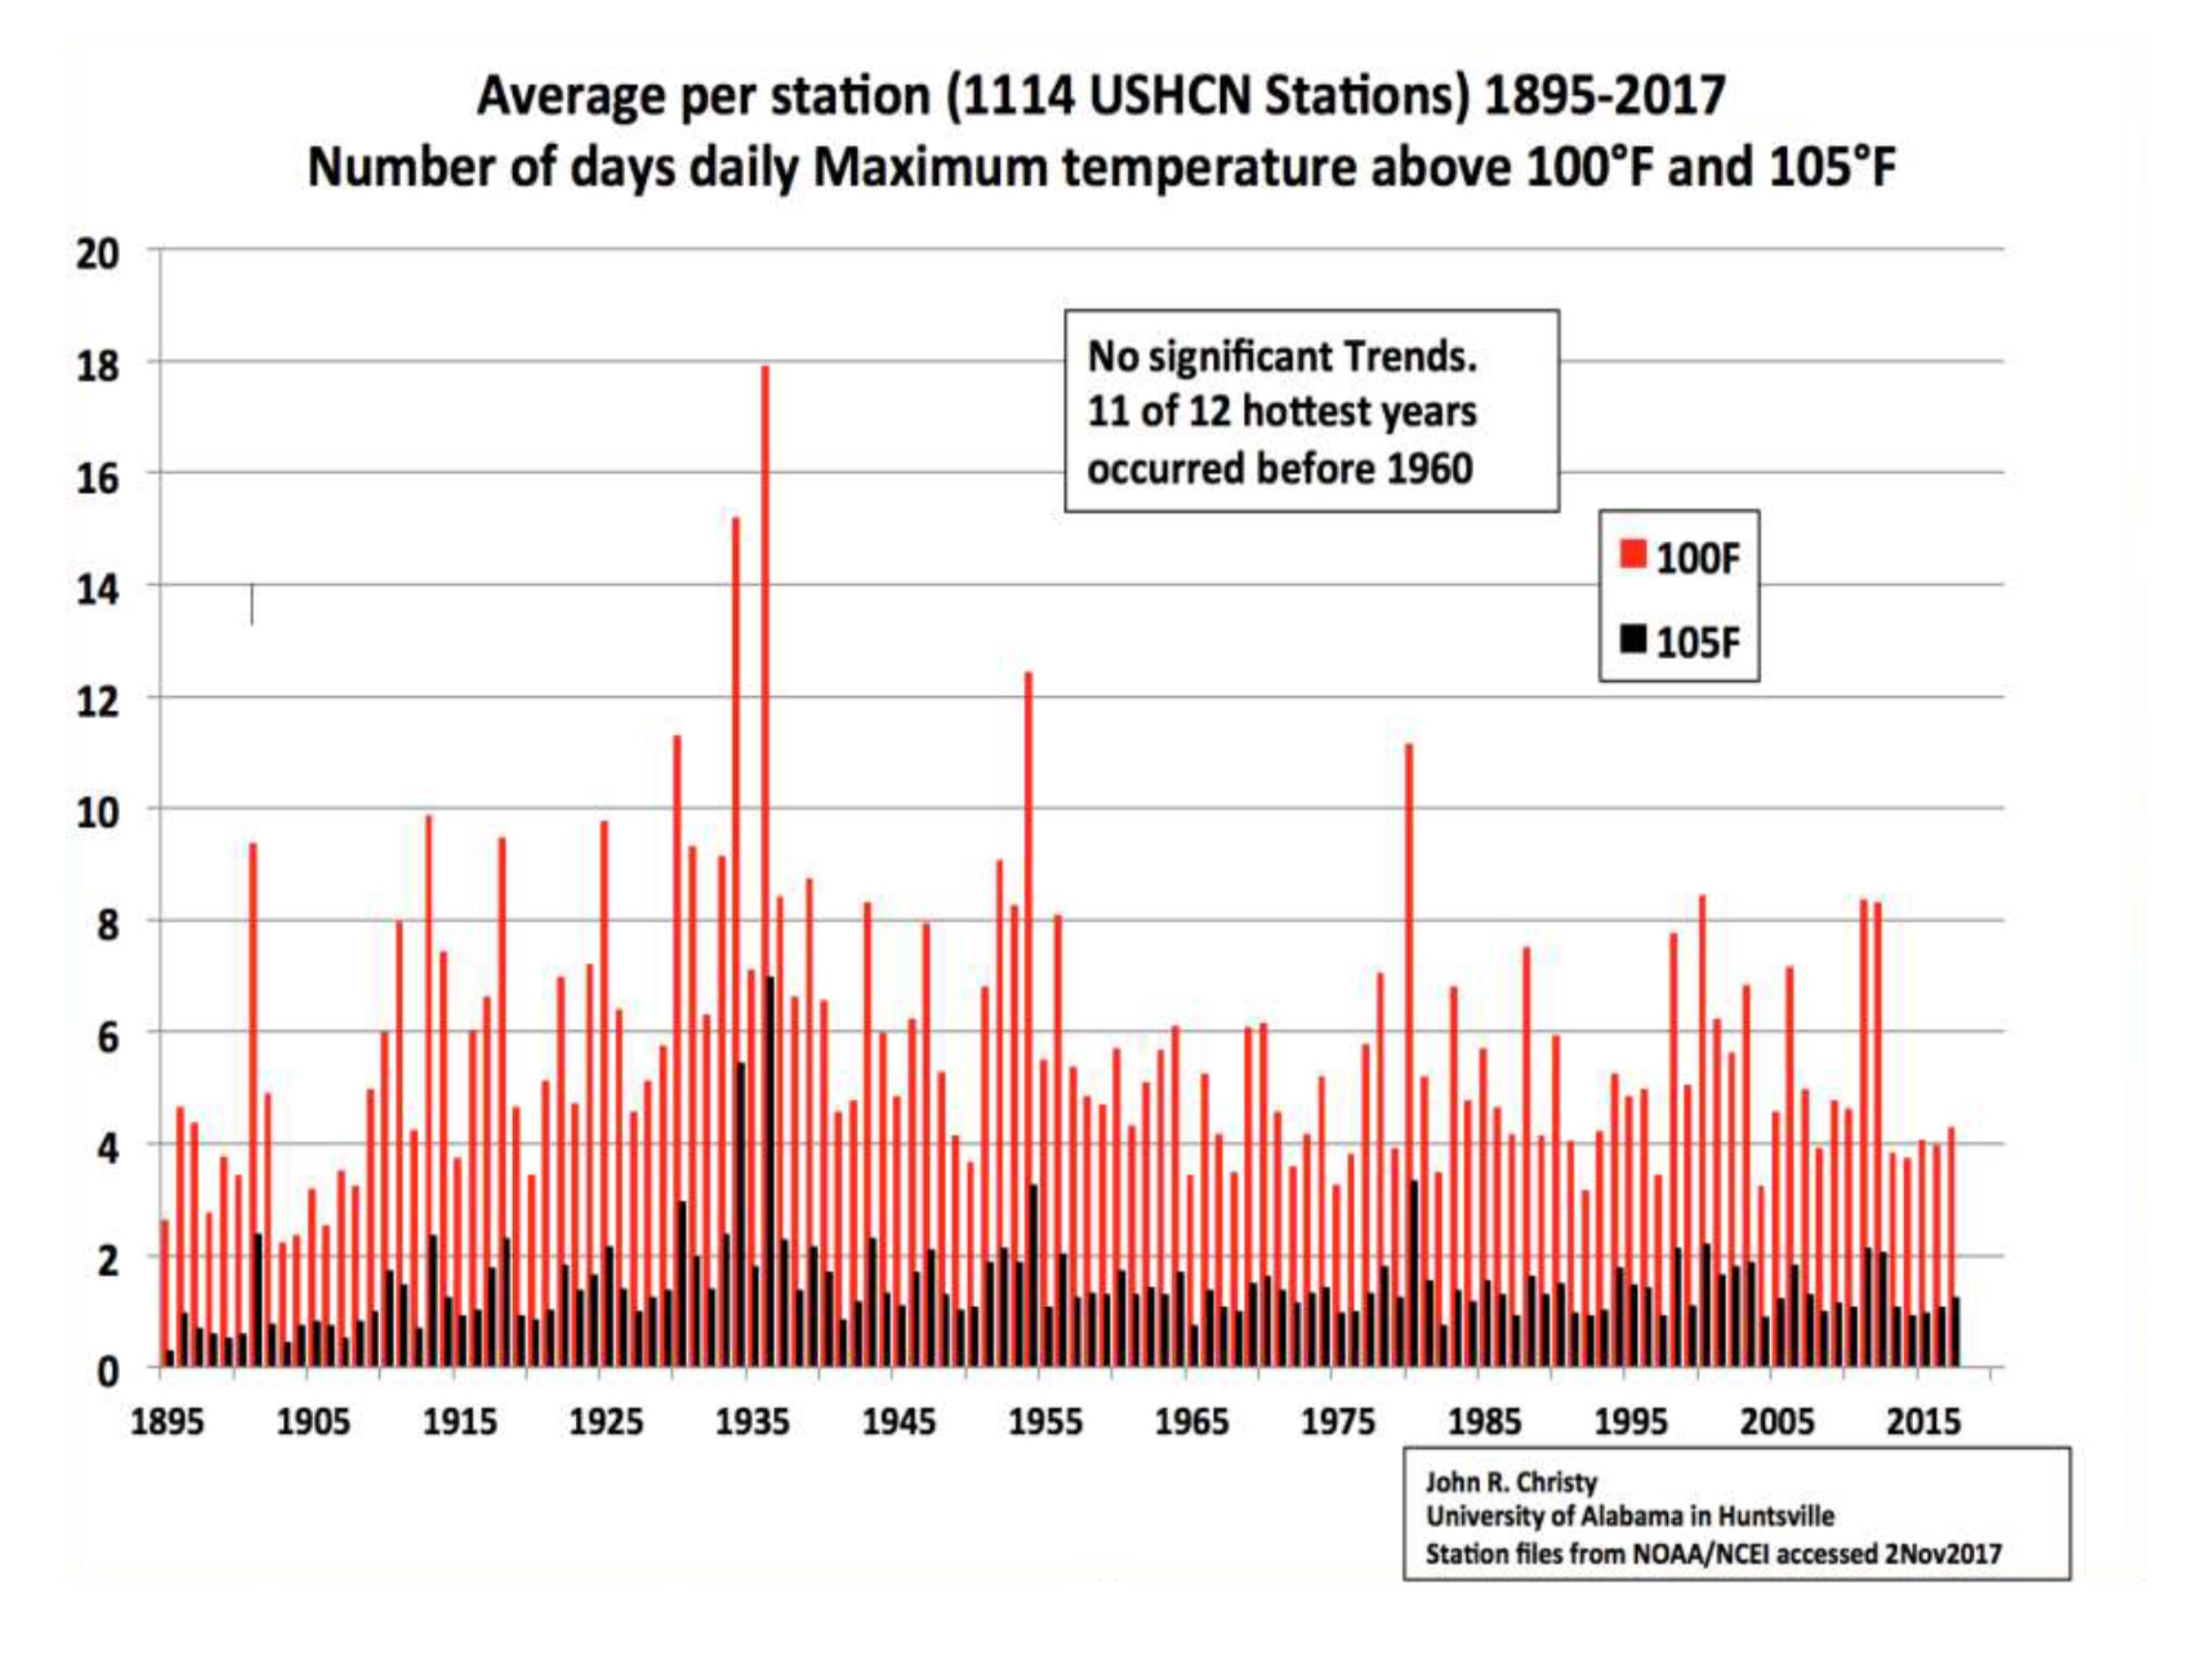
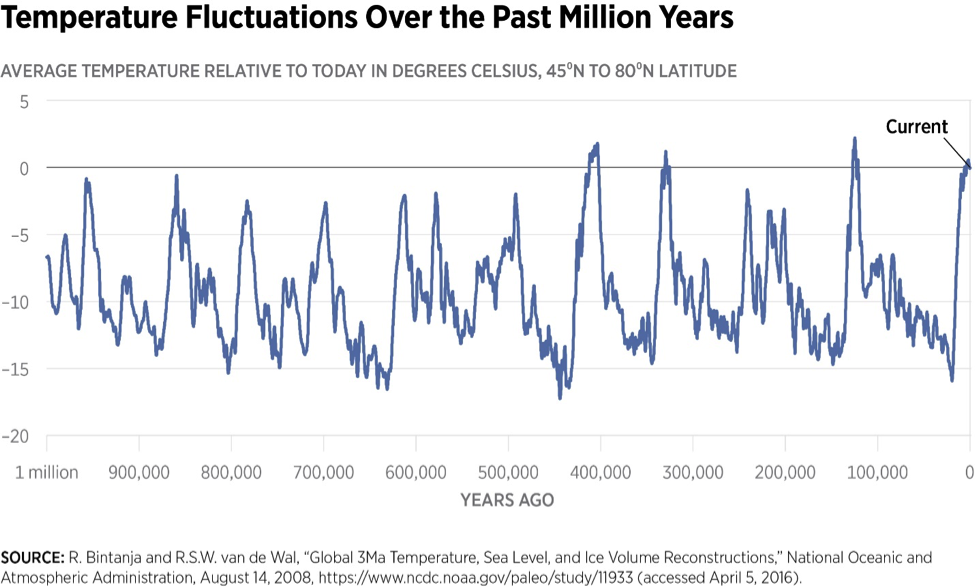
The “crisis” assertions are unsupported by the evidence reported in the peer-reviewed, official, or scientific literature. There is little trend in the number of “hot” days for 1895–2017; 11 of the 12 years with the highest number of such days occurred before 1960.[5] NOAA has maintained since 2005 the U.S. Climate Reference Network, comprising 114 meticulously maintained temperature stations spaced more or less uniformly across the lower 48 states, 21 stations in Alaska, and two stations in Hawaii.[6] They are placed to avoid heat island effects and other such distortions as much as possible; the reported data show no trend over the available 2005–20 reporting period.[7] A reconstruction of global temperatures over the past one million years, using data from ice sheet formations, shows that there is nothing unusual about the current warm period.[8]
Global mean sea level has been increasing at about 3.3 mm per year since satellite measurements began in 1992. The tidal-gauge data before then show annual increases of about 1.9 mm per year, but that comparison does not show an acceleration in sea-level rise because the two datasets are not comparable. The tidal gauges do not measure sea levels per se; they measure the difference between sea levels and “fixed” points on land that in reality might not be fixed due to seismic activity, tectonic shifts, land settlement, etc. Accordingly, the data are unclear as to whether there is occurring an acceleration in sea level rise; it is reasonable to hypothesize that there has been such an acceleration simply because temperatures are rising due to both natural and anthropogenic influences, as noted above, and such increases should result in more melting ice and the thermal expansion of water. But because rising temperatures are the result of both natural and anthropogenic causes, we do not know the relative contributions of those causes to any such acceleration.[9]
The Northern and Southern Hemisphere sea ice changes tell different stories; the arctic sea ice has been declining, while the Antarctic sea ice has been stable or growing.[10] U.S. tornado activity shows either no trend or a downward trend since 1954.[11] Tropical storms, hurricanes, and accumulated cyclone energy show little trend since satellite measurements began in the early 1970s.[12] The number of U.S. wildfires shows no trend since 1985, and global acreage burned has declined over past decades.[13] The Palmer Drought Severity index shows no trend since 1895,[14] and during the past century the percent of the globe in drought has not changed.[15]
U.S. flooding over the past century is uncorrelated with increasing GHG concentrations.[16] The available datado not support the ubiquitous assertions about the dire impacts of declining pH levels in the oceans.[17] Global food availability and production have increased more or less monotonically over the past two decades on a per capita basis.[18]The IPCC itself in the Fifth Assessment Report was deeply dubious about the various severe effects often asserted to be looming as impacts of anthropogenic warming.[19]
If we apply the Environmental Protection Agency climate model, under the highest IPCC climate sensitivity assumption (4.5 degrees C as reported in the AR5), net-zero U.S. GHG emissions effective immediately would yield a reduction in global temperatures of 0.173 degrees C by 2100. That effect would be barely detectable given the standard deviation (about 0.11 degrees C) of the surface temperature record.[20] The entire Paris agreement: about 0.178 degrees C. A 50 percent reduction in Chinese GHG emissions: 0.184 degrees C. Net-zero emissions by the entire Organization for Economic Cooperation and Development: 0.352 degrees C. A global 50 percent reduction in GHG emissions implemented immediately and maintained strictly would reduce global temperatures in 2100 by 0.687 degrees C.[21]Note that GHG emissions in 2020 fell by about 6.4 percent as a result of the COVID-19 economic downturn.[22] Can anyone believe that even larger GHG reductions — and the attendant economic costs — are plausible politically? Is there a believable benefit/cost model that would justify such policies?
I betray no secret when I say that all of us are poorer as a result of Pat’s passing. May Patrick J. Michaels rest in peace, and may his memory inspire all of us to strive toward his standard of rigor, honesty, and courage.
[1] See Knappenberger’s remembrance of Pat at https://www.masterresource.org/debate-issues/remembering-pat-michaels/.
[2] On the carbon dioxide “greening” effect see NOAA at https://www.nasa.gov/feature/goddard/2016/carbon-dioxide-fertilization-greening-earth; and Zaichun Zhu, et. al., “Greening of the Earth and Its Drivers,” Nature Climate Change, Vol. 6 (2016), pp. 791-795, at https://www.nature.com/articles/nclimate3004. On the agricultural productivity effects, see, e.g., Goudriaan and Unsworth at https://acsess.onlinelibrary.wiley.com/doi/abs/10.2134/asaspecpub53.c8. On water use efficiency by plants, see, e.g., http://www.co2science.org/subject/w/summaries/wateruse.php. On the beneficial impacts of moderate warming on mortality, see https://www.thelancet.com/journals/lancet/article/PIIS0140-6736(14)62114-0/fulltext. On the increase in the length of the U.S. growing season, see the EPA discussion at https://www.epa.gov/climate-indicators/climate-change-indicators-length-growing-season.
[3] On the surface (land/ocean) temperature record, see UK Met Office, Hadley Centre/University of East Anglia Climatic Research Unit, “Tim Osborn: HadCRUT4 Global Temperature Graphs,” https://crudata.uea.ac.uk/~timo/diag/tempdiag.htm. On the Little Ice Age, see Michael E. Mann, “Little Ice Age,” in Encyclopedia of Global Environmental Change, Volume 1: The Earth System: Physical and Chemical Dimensions of Global Environmental Change, ed. Michael C. MacCracken, John S. Perry and Ted Munn (Chichester, England: John Wiley & Sons, 2002), http://www.meteo.psu.edu/holocene/public_html/shared/articles/littleiceage.pdf.
[4] See https://crudata.uea.ac.uk/cru/data/temperature/HadCRUT5.0Analysis_300.png. See also Ross McKitrick and John Christy, “A Test of the Tropical 200- to 300 hPa Warming Rate in Climate Models”; Nicholas Lewis and Judith Curry, “The Impact of Recent Forcing and Ocean Heat Uptake Data on Estimates of Climate Sensitivity,” Journal of Climate 31 (August 2018): 6051–71, https://journals.ametsoc.org/doi/pdf/10.1175/JCLI-D-17-0667.1; and John R. Christy and Richard McNider, “Satellite Bulk Tropospheric Temperatures as a Metric for Climate Sensitivity,” Asia-Pacific Journal of Atmospheric Sciences 53 (2017): 511–18, https://link.springer.com/article/10.1007/s13143-017-0070-z. For a chart summarizing the recent empirical estimates of equilibrium climate sensitivity as reported in the peer-reviewed literature, see Patrick J. Michaels and Paul C. Knappenberger, “The Collection of Evidence for a Low Climate Sensitivity Continues to Grow,” Cato Institute, September 25, 2014, https://www.cato.org/blog/collection-evidence-low-climate-sensitivity-continues-grow.
[5] For the reconstruction of the NASA data, see John R. Christy, “Average per Station (1114 USHCN Stations) 1895–2017: Number of Days Daily Maximum Temperature Above 100˚F and 105˚F,” drroyspencer.com, http://www.drroyspencer.com/wp-content/uploads/US-extreme-high-temperatures-1895-2017.jpg.
[6] For the Climate Reference Network program description, see National Centers for Environmental Information, “U.S. Climate Reference Network,” https://www.ncdc.noaa.gov/crn/.
[7] For a visualization of a prototypical station, see Willis Eschenbach, “NOAA’s USCRN Revisited—No Significant Warming in the USA in 12 Years,” Watts Up with That?, November 8, 2017, https://wattsupwiththat.com/2017/11/08/the-uscrn-revisited/. For the monthly data and charts reported by the National Oceanic and Atmospheric Administration (NOAA), see National Oceanic and Atmospheric Administration, “National Temperature Index,” https://www.ncdc.noaa.gov/temp-and-precip/national-temperature-index/time-series?datasets%5B%5D=uscrn¶meter=anom-tavg&time_scale=p12&begyear=2005&endyear=2020&month=8.
[8] See R. Bintanja and R. S. W. van de Wal, “North American Ice-Sheet Dynamics and the Onset of 100,000-Year Glacial Cycles,” Nature 454, no. 7206 (August 14, 2008): 869–72, https://www.researchgate.net/publication/23171740_Bintanja_R_van_de_Wal_R_S_W_North_American_ice-sheet_dynamics_and_the_onset_of_100000-year_glacial_cycles_Nature_454_869-872. NOAA published the underlying data at R. Bintanja and R. S. W. van de Wal, “Global 3Ma Temperature, Sea Level, and Ice Volume Reconstructions,” National Oceanic and Atmospheric Administration, August 14, 2008, https://www.ncdc.noaa.gov/paleo-search/study/11933. For a chart showing the temperature record over one million years, see Institute for Energy Research, “Temperature Fluctuations over the Past Million Years,” https://www.instituteforenergyresearch.org/wp-content/uploads/2020/03/temperature-flucturations.png.
[9] See Frederikse et. al. at https://www.nature.com/articles/s41586-020-2591-3. As a crude approximation, the data suggest that about two-thirds of such sea level increases are due to ice melt, and one-third to thermal expansion of water. See Judith Curry, “Sea Level and Climate Change,” Climate Forecast Applications Network, November 25, 2018, https://curryja.files.wordpress.com/2018/11/special-report-sea-level-rise3.pdf. Curry cites research from Xianyao Chen and colleagues, the central finding of which is that “global mean sea level rise increased from 2.2 ± 0.3 mm/year in 1993 to 3.3 ± 0.3 mm/year in 2014.” See Xianyao Chen et al., “The Increasing Rate of Global Mean Sea-Level Rise During 1993–2014,” Nature Climate Change 7 (June 26, 2017): 492–95, https://www.nature.com/articles/nclimate3325. Whether the trend from a 21-year period can yield important inferences is a topic not to be addressed here. For a different empirical conclusion from the tidal gauge record, see J. R. Houston and R. G. Green, “Sea-Level Acceleration Based on U.S. Tide Gauges and Extensions of Previous Global-Gauge Analyses,” Journal of Coastal Research 27, no. 3 (May 2011): 409–17, https://meridian.allenpress.com/jcr/article-abstract/27/3/409/28456/Sea-Level-Acceleration-Based-on-U-S-Tide-Gauges?redirectedFrom=fulltext. For an example of temporary rapid sea-level rise in the 18th century, see W. R. Gehrels et al., “A Preindustrial Sea-Level Rise Hotspot Along the Atlantic Coast of North America,” Geophysical Research Letters 47 (2020), https://agupubs.onlinelibrary.wiley.com/doi/epdf/10.1029/2019GL085814. For further reported evidence of an acceleration, see Hans-Otto Pörtner et al., Special Report on the Ocean and Cryosphere in a Changing Climate, Intergovernmental Panel on Climate Change, 2019, https://www.ipcc.ch/srocc/.
[10] See https://www.thegwpf.org/content/uploads/2021/12/Bates-Sea-Ice-Trends.pdf?mc_cid=dac7df538b&mc_eid=ad653edd6d; and https://www.thegwpf.org/content/uploads/2022/04/Humlum-State-of-Climate-2021-.pdf?mc_cid=dac7df538b&mc_eid=ad653edd6d. See also Patrick J. Michaels, “Spinning Global Sea Ice,” Cato Institute, February 12, 2015, https://www.cato.org/blog/spinning-global-sea-ice. It appears to be the case that the Antarctic eastern ice sheet — about two-thirds of the continent — is growing, while the western ice sheet (and the peninsula) may be shrinking. No agreed explanation for this phenomenon is reported in the literature.
[11] For the historical data reported by the NOAA, see National Ocean and Atmospheric Administration, “Historical Records and Trends,” https://www.ncdc.noaa.gov/climate-information/extreme-events/us-tornado-climatology/trends.
[12] For data on global tropical cyclone activity, see Ryan N. Maue, “Global Tropical Cyclone Activity, updated March 16, 2021, at http://climatlas.com/tropical/.
[13] For the reported U.S. wildfire data, see National Interagency Fire Center, “Total Wildland Fires and Acres (1926–2019),” https://www.nifc.gov/fireInfo/fireInfo_stats_totalFires.html. On the decline in global area burned over past decades, see Stefan H. Doerr and Cristina Santin, “Global Trends in Wildfire and Its Impacts: Perceptions Versus Realities in a Changing World,” Philosophical Transactions of the Royal Society of London, Series B, Biological Sciences 371, no. 1696 (2016), https://www.ncbi.nlm.nih.gov/pmc/articles/PMC4874420/pdf/rstb20150345.pdf.
[14] See US Environmental Protection Agency, “Climate Change Indicators: Drought,” https://www.epa.gov/climate-indicators/climate-change-indicators-drought; and US Department of Commerce, National Climatic Data Center, “Divisional Data Select,” https://www7.ncdc.noaa.gov/CDO/CDODivisionalSelect.jsp.
[15] See Gregory J. McCabe and David M. Wolock, “Variability and Trends in Global Drought,” Earth and Space Science, Vol. 2, Issue 6 (June 2015) at https://agupubs.onlinelibrary.wiley.com/doi/10.1002/2015EA000100.
[16] See R. M. Hirsch and K. R. Ryberg, “Has the Magnitude of Floods Across the USA Changed with Global CO2 Levels?,” Hydrological Sciences Journal 57, no. 1 (2012): 1–9, https://www.tandfonline.com/doi/full/10.1080/02626667.2011.621895?scroll=top&needAccess=true&.
[17] See CO2 Science, “Ocean Acidification Database,” http://www.co2science.org/data/acidification/results.php. See also Alan Longhurst, Doubt and Certainty in Climate Science, pp. 214–25, https://curryja.files.wordpress.com/2015/09/longhurst-print.pdf.
[18] See Food and Agriculture Organization of the United Nations, World Food and Agriculture Statistical Pocketbook 2018, 2018, Charts 28 and 46, http://www.fao.org/3/CA1796EN/ca1796en.pdf. See also Kevin D. Dayaratna, Ross McKitrick, and Patrick J. Michaels, “Climate Sensitivity, Agricultural Productivity and the Social Cost of Carbon in FUND,” Environmental Economics and Policy Studies 22 (2020): 433–48.
[19] Julie M. Arblaster et al., “Long-Term Climate Change: Projections, Commitments and Irreversibility—Final Draft Underlying Scientific-Technical Assessment,” in Working Group I Contribution to the IPCC Fifth Assessment Report (AR5), Climate Change 2013: The Physical Science Basis, September 23–26, 2013, Table 12.4, at https://www.ipcc.ch/site/assets/uploads/2018/02/WG1AR5_Chapter12_FINAL.pdf.
[20] See https://agupubs.onlinelibrary.wiley.com/doi/pdf/10.1029/1999JD900835.
[21] Author computations using MAGICC 5.3. The MAGICC model can be found at http://www.magicc.org/.
[22] See https://www.nature.com/articles/d41586-021-00090-3.