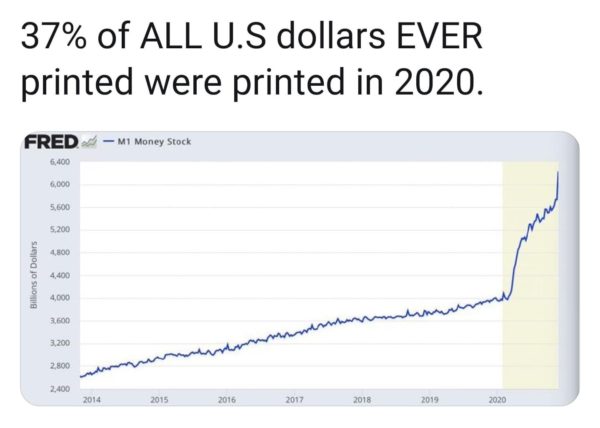
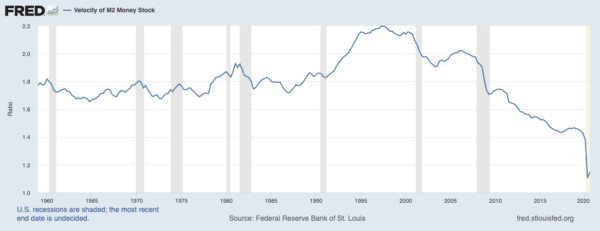
• With near-President Biden proposing to spend $1.9 trillion out of the gate in what will likely be just a down payment on the next wave of the liberal agenda, worth thinking about what could possibly go wrong. Well, maybe inflation, or a crash (or both). Right now we aren’t seeing much inflation, even though the Federal Reserve is goosing the money supply like it’s 2009 on steroids. That’s the first chart here. One reason inflation isn’t ticking up is that people aren’t spending their dollars, as reflected in the second chart of “velocity” (one of the key variables of monetary economics) from 1960-2020. What happens if velocity picks up at some point in the next couple years? Inflation probably achieves escape velocity, and welcome to 1979.
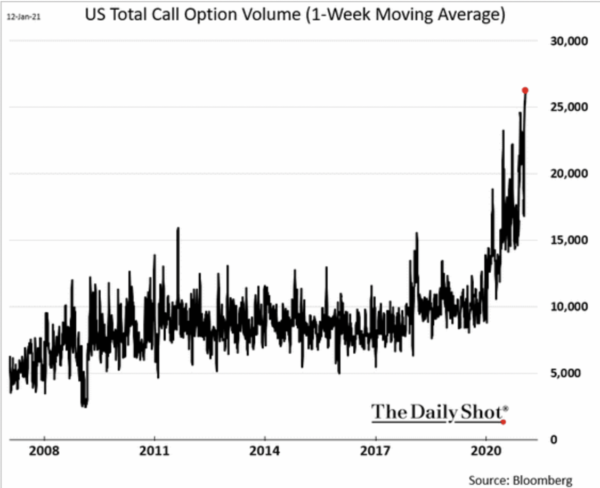
• Meanwhile, one place inflation is manifesting itself is in certain asset classes, especially stocks but also real estate. And this chart displays the kind of speculative excess that often ends with a crash—too much options trading by rookies.
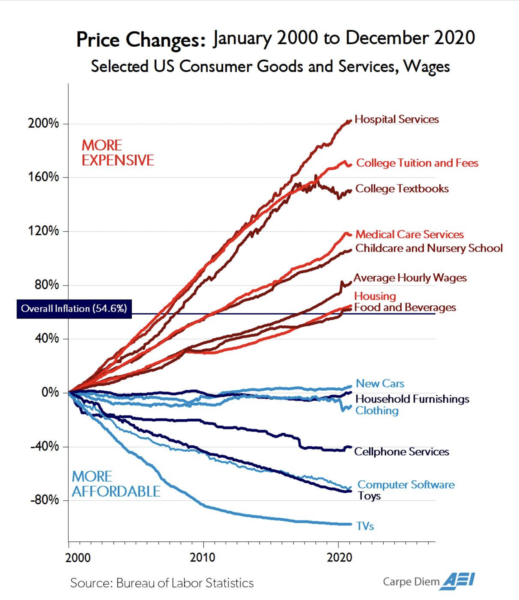
But here’s another look at inflation over the years from our pal Mark Perry—notice anything about the differences between the categories above the Zero-line and below the Zero-line:
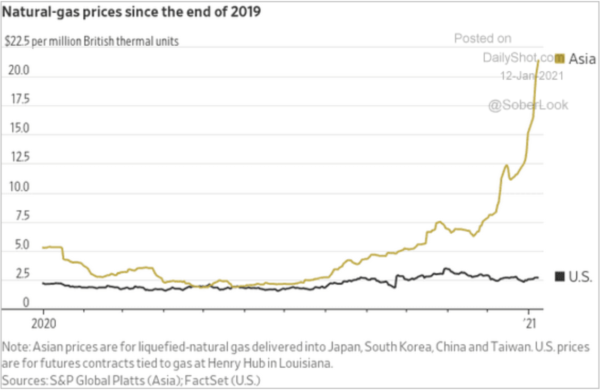
• This is what happens when you don’t have energy independence:
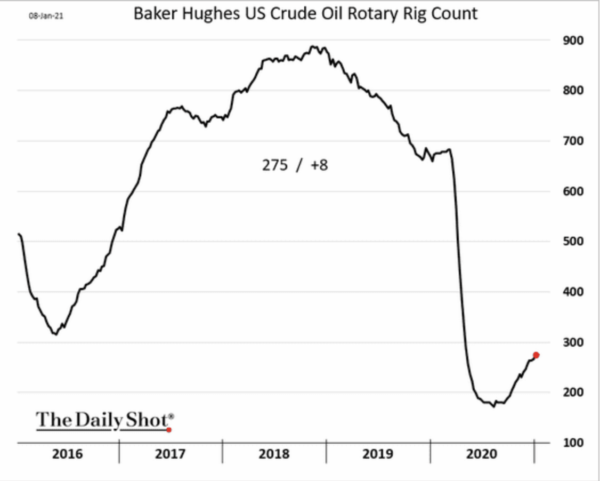
The good news is, rig activity in the U.S. is starting to pick up—drill, baby, drill!
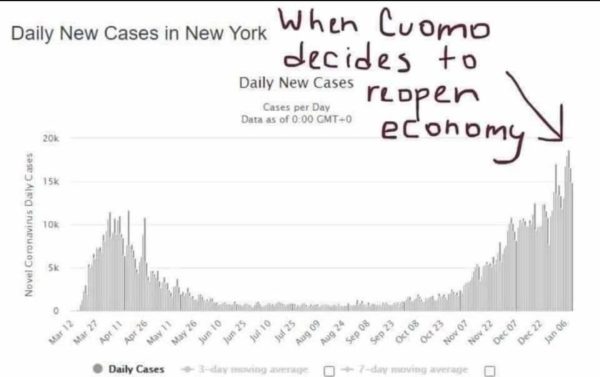
• Lockdown hypocrisy in one chart:
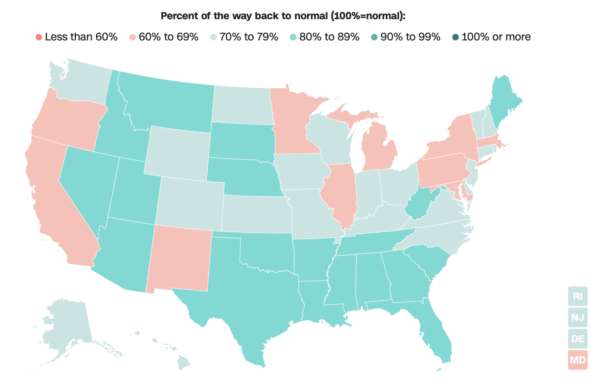
Also, anyone notice a rough political correlation here:
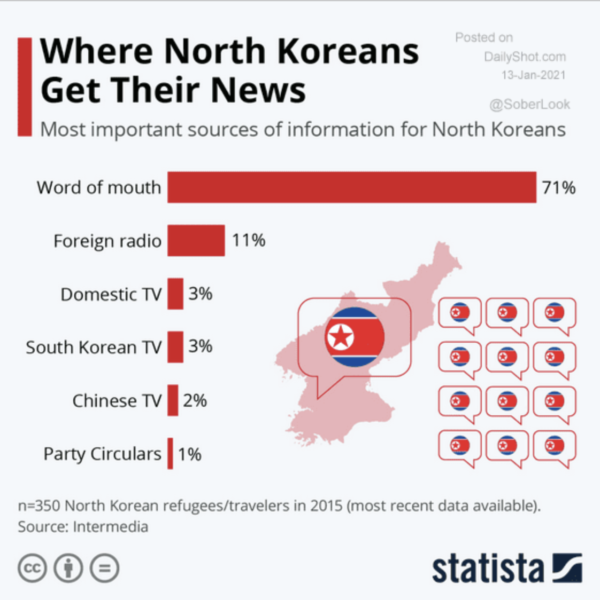
• Coming soon to the US, since no one will trust our digital overlords much longer?
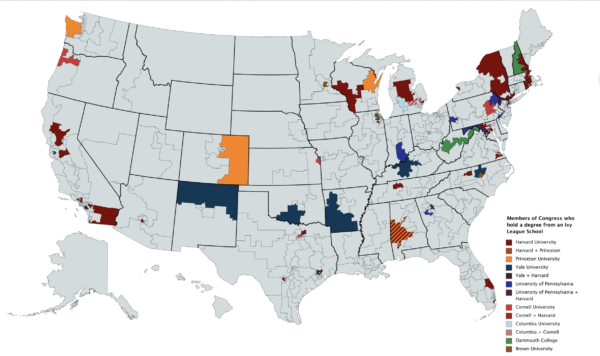
• Member of Congress with Ivy League degrees:
Notice: All comments are subject to moderation. Our comments are intended to be a forum for civil discourse bearing on the subject under discussion. Commenters who stray beyond the bounds of civility or employ what we deem gratuitous vulgarity in a comment — including, but not limited to, “s***,” “f***,” “a*******,” or one of their many variants — will be banned without further notice in the sole discretion of the site moderator.