A lot of new charts and graphs have emerged such that my data folder is groaning. So here they come.
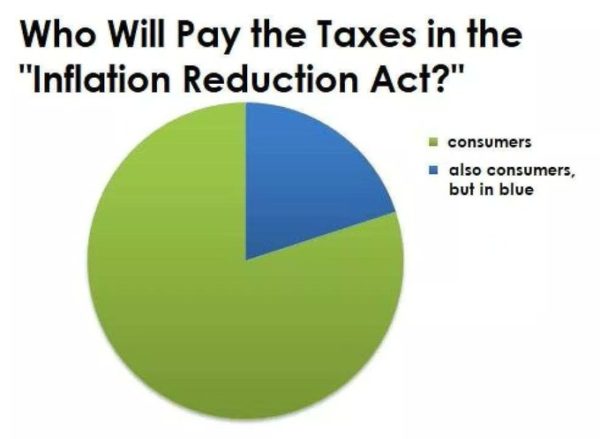
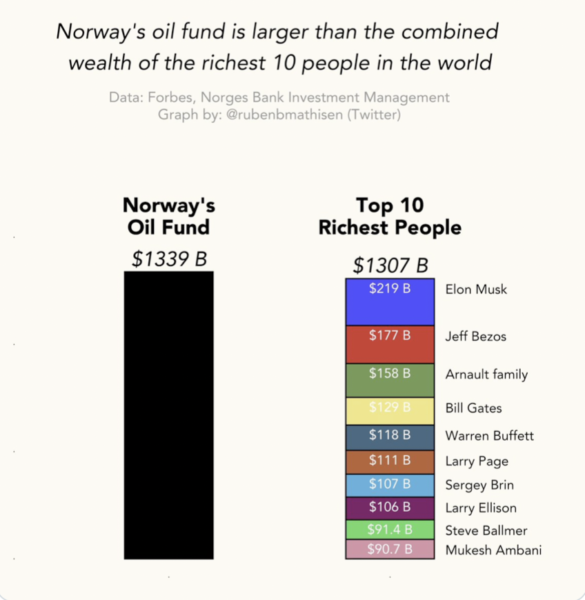
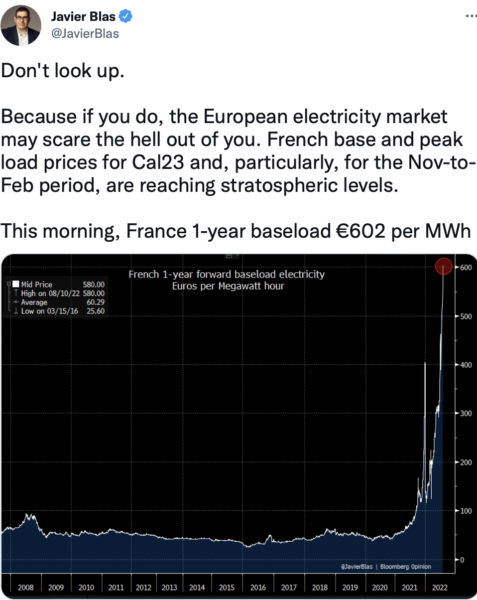
• Let’s start with some energy charts, germane in the aftermath of the recent climate bill:
And we’re going to store wind and solar electricity on lithium-ion batteries. Um:
Gasoline consumption this summer is noticeably down—gee I wonder why?
Which is probably why so many Americans have this common-sense view:
• Nice going scientists:
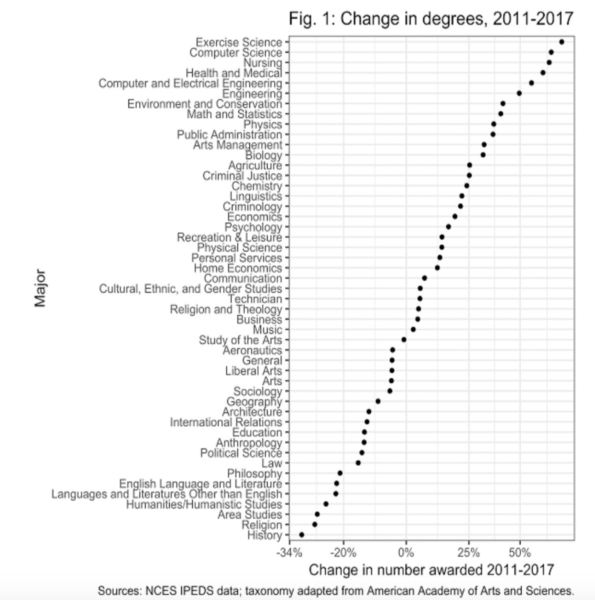
• The decline in the humanities and social scientists, facing a market test:
And here’s the flip side—students are voting with their feet, so to speak:
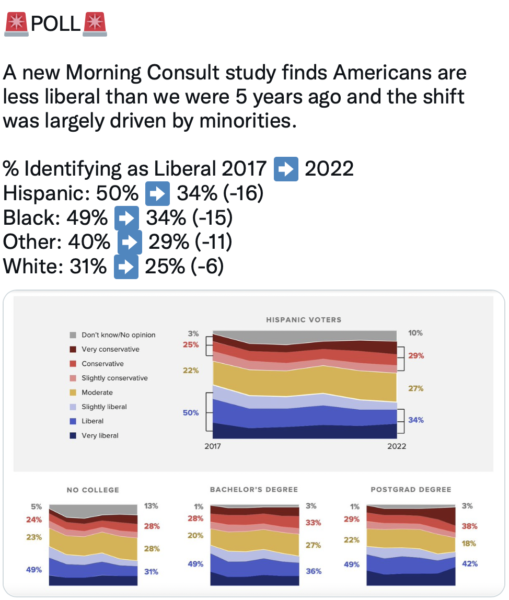
• Politics—suddenly even fewer Democrats are down for the race hustle:
Look closely at the class of 2025 demographic profile in this boast from John Hopkins University:
Is it really plausible that the hispanic and white applicants had the same number with the same qualifications for admission?
And this is what lockdowns and pushing CRT will do to the usual Democratic advantage on education issues:
The English social scientist David Goodhart likes to describe the Trump-Brexit-Nationalist-Populist sentiment as a division between the cosmopolitan “anywheres” and the place-based “somewheres,” and this chart bears him out:
And yet another reason to repeal the 19th Amendment:
• No wonder China has repealed its “One Child” policy:
• Sure, this will end well. . .
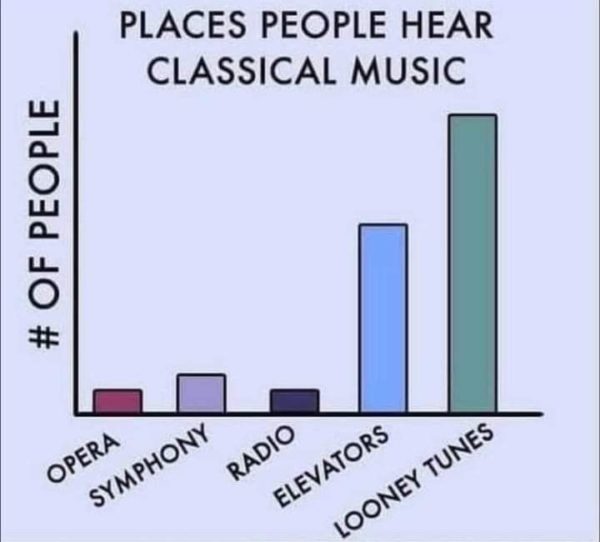
And finally. . .











Notice: All comments are subject to moderation. Our comments are intended to be a forum for civil discourse bearing on the subject under discussion. Commenters who stray beyond the bounds of civility or employ what we deem gratuitous vulgarity in a comment — including, but not limited to, “s***,” “f***,” “a*******,” or one of their many variants — will be banned without further notice in the sole discretion of the site moderator.