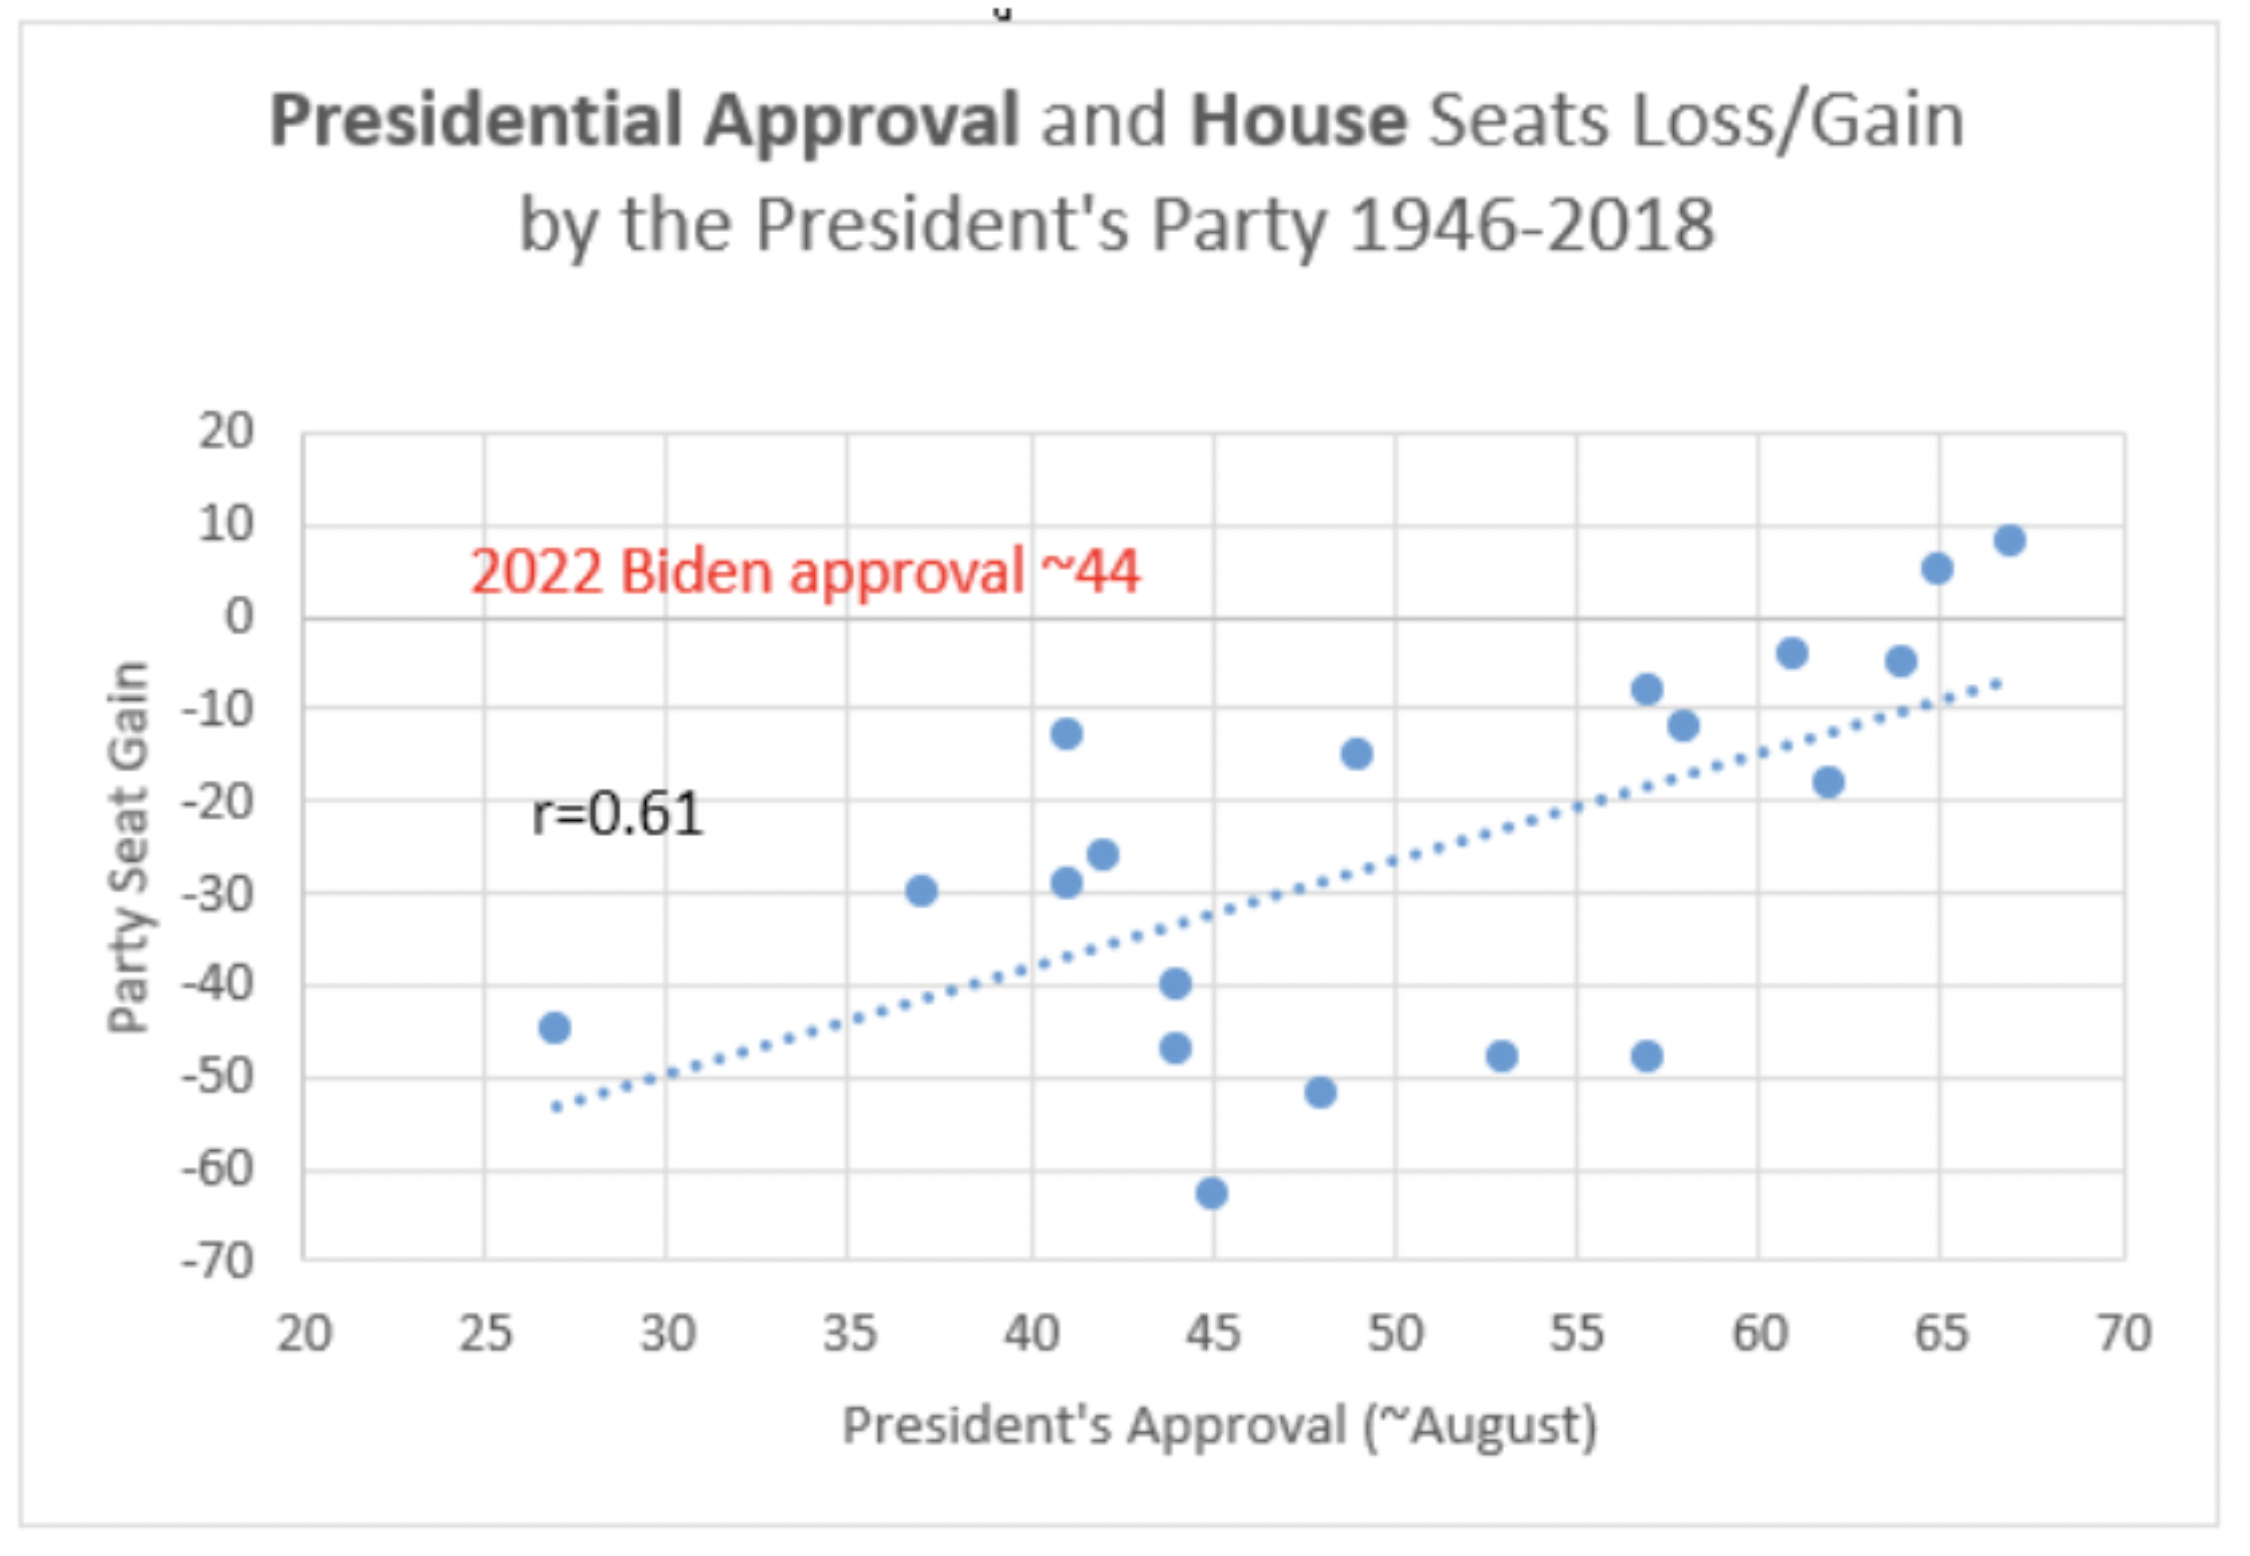
The more we look at the election result last week the more perplexing it becomes. What the two longitudinal charts below show is that a president at 44 percent (at best) approval rating and inflation at (“officially”) 8 percent should lose—at a minimum—10 House seats. If the Dem losses are kept to about 10 this election will be seen as one of the greatest anomalies in election history. (Of course, the fact that Republican candidates outpolled Democratic candidates by more than 5 million votes makes the whole scene more confusing and curious still.)

Notice: All comments are subject to moderation. Our comments are intended to be a forum for civil discourse bearing on the subject under discussion. Commenters who stray beyond the bounds of civility or employ what we deem gratuitous vulgarity in a comment — including, but not limited to, “s***,” “f***,” “a*******,” or one of their many variants — will be banned without further notice in the sole discretion of the site moderator.