Most Americans are now subject to “stay-home” orders of one kind or another, issued by state and local authorities, and countless “nonessential” businesses have been shut down. Millions have been thrown out of work, and thousands of businesses that have been shuttered will never reopen. The stock market has crashed, destroying the life’s savings of millions. Many millions of lives, in short, have been devastated by governments’ responses to the COVID-19 virus.
The justification for stay-home orders, closing of “non-essential” businesses, and so on, as we have often been told, is “flattening the curve.” Sheltering in place won’t prevent the COVID-19 virus from working its way through the population, it will just do so more slowly. The idea is that if we all get sick at once, it will overstrain medical resources, especially ICU beds and ventilators, while if we stretch out the timing of the epidemic, a similar number of people may ultimately get sick, but a higher percentage of seriously ill persons will have access to those medical resources. We have all seen this graph, which illustrates the point, many times:
![]()
One can estimate the number of lives saved through stay-home orders and other curve-flattening measures in this way:
Create two graphs, in the manner illustrated in the above chart. Case A represents the natural course of the disease with no flattening measures. (Or, perhaps, with certain baseline measures, e.g., restricting travel from China. I have never seen this made clear.) Case A estimates the number of infected people for whom hospitalization will be indicated, and for whom a ventilator will be indicated, over the course of the epidemic, and compares those estimates to the quantity of ICU rooms and ventilators available in a given location (e.g., a state). This yields a number of patients who ought to receive such treatments, but don’t.
Next we apply mortality statistics: we assume, for example, that patients for whom a ventilator is indicated have a 75% chance of survival if they get a ventilator, but only 25% if they don’t. The numbers might look like this: Start with a state with a population of 1 million; assume that one-half of them contract the virus. Of those 500,000, assume that 5 percent, or 25,000, will need a ventilator at some point. Calculate further that due to a spike in demand from the epidemic, only 15,000 will have timely access to a ventilator, while 10,000 will not. The number who die among those who needed a ventilator, on these assumptions, is .25 x 15,000 = 3,750, plus .75 x 10,000 = 7,500, or 11,250.
We then compare that to Case B, where the curve is flattened. Let’s assume that the flattening is entirely successful, so that every one of the 25,000 who need a ventilator gets access to one. The death toll on Case B is then .25 x 25,000 = 6,250. So on these assumptions, flattening the curve can be expected to save 5,000 lives. (I am not, of course, suggesting that these numbers are correct or reasonable, but simply using them to illustrate how curve-flattening is supposed to work.) One could perform a similar analysis for ICU beds and add those numbers to the ventilator analysis, although that probably wouldn’t add much, if anything, since for the present purpose an ICU room is basically a room with a ventilator.
As usual with models, the math is relatively simple. It is the assumptions that are critical.
In the U.K., Imperial College scientist Neil Ferguson notoriously revised his U.K. fatality projection from 500,000 to fewer than 20,000, with most of those being people who would have died this year, anyway. Ferguson said this drastic reassessment was due to the draconian stay-home order promulgated by the British government.
I am not calling Ferguson a liar, but I would love to see the assumptions and calculations underlying his about-face. Are there really numbers for Case A (500,000 fatalities) and Case B (fewer than 20,000) attributable to curve-flattening that 1) are plausible on their face, and 2) have substantial empirical support? Consider me skeptical.
The University of Washington’s Institute for Health Metrics and Evaluation has a set of coronavirus mortality projections that have been getting a lot of attention. I wrote about them here. I characterized the IHME numbers as relatively optimistic, because they forecast a total of a little over 81,000 deaths in the U.S.
I am particularly interested in the IHME project because it includes state-by-state forecasts. For Minnesota, it currently projects 1,039 deaths. This is in marked contrast with the model on which Minnesota’s governor claims to have relied when he issued the state’s shutdown order. That model, according to the governor, projected more than 70,000 deaths in the state unless people were ordered to stay home and businesses were closed. He hasn’t said, to my knowledge, how much good his stay-home order will do, according to the same model.
In commenting on my post, Paul suggested that the difference between the two projections—1,039 vs. more than 70,000—is that the University of Washington analysis takes into account the impact of the stay-home order, business closings, restrictions on meetings, and so on, so that the difference represents the benefit of our governor’s order.
That was a plausible assumption, but I don’t think it is correct. Did IHME project 70,000 deaths in Minnesota, and revise that prediction dramatically downward when Governor Walz issued his order? I can’t be certain as I didn’t see the IHME site until after the fact, and I can’t find versions of the model predating March 30 on the IHME site. But, even apart from the fact that 70,000 could never have been a reasonable mortality projection for Minnesota when the entire nation is only a little over 80,000, I don’t think that is what happened.
IHME’s state-by-state projections do not appear to vary depending on the prophylactic actions taken (or not taken) by each state’s government. Thus, here is the projection for Minnesota, which has a harsh shutdown order in place. Currently it projects 1,039 deaths. Click to enlarge:
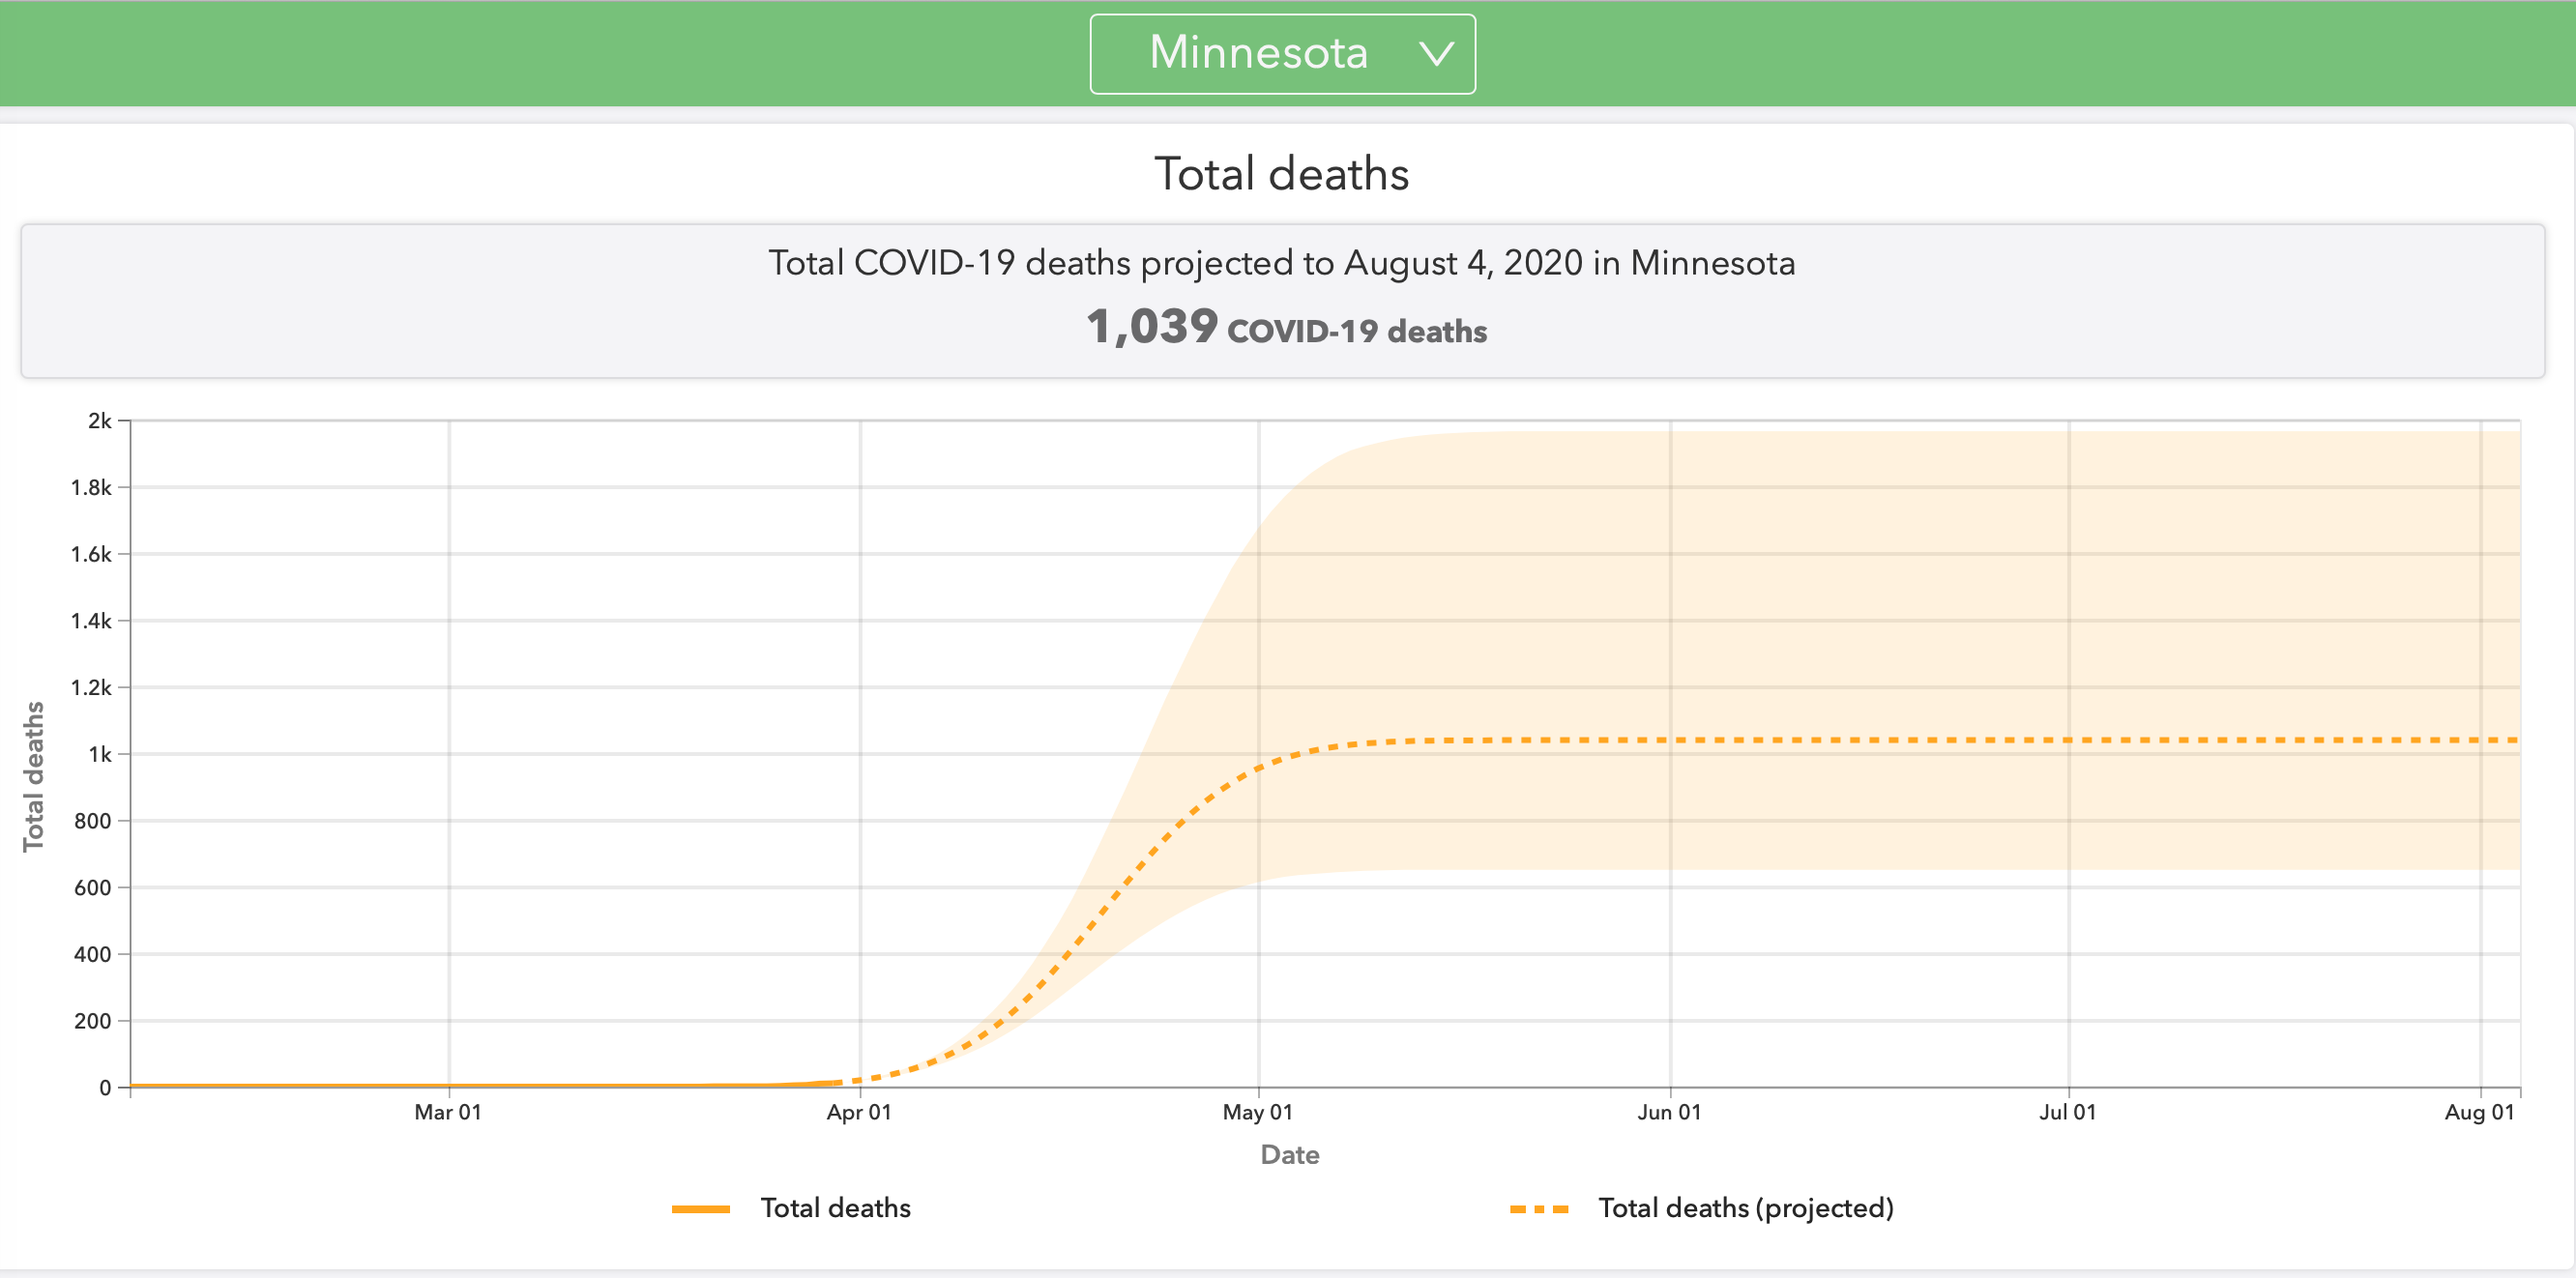
IHME notes that Minnesota has a “stay at home order” as of March 27. But now let’s compare Iowa, which, as IHME says, does not have a stay-home order and has not closed nonessential businesses:
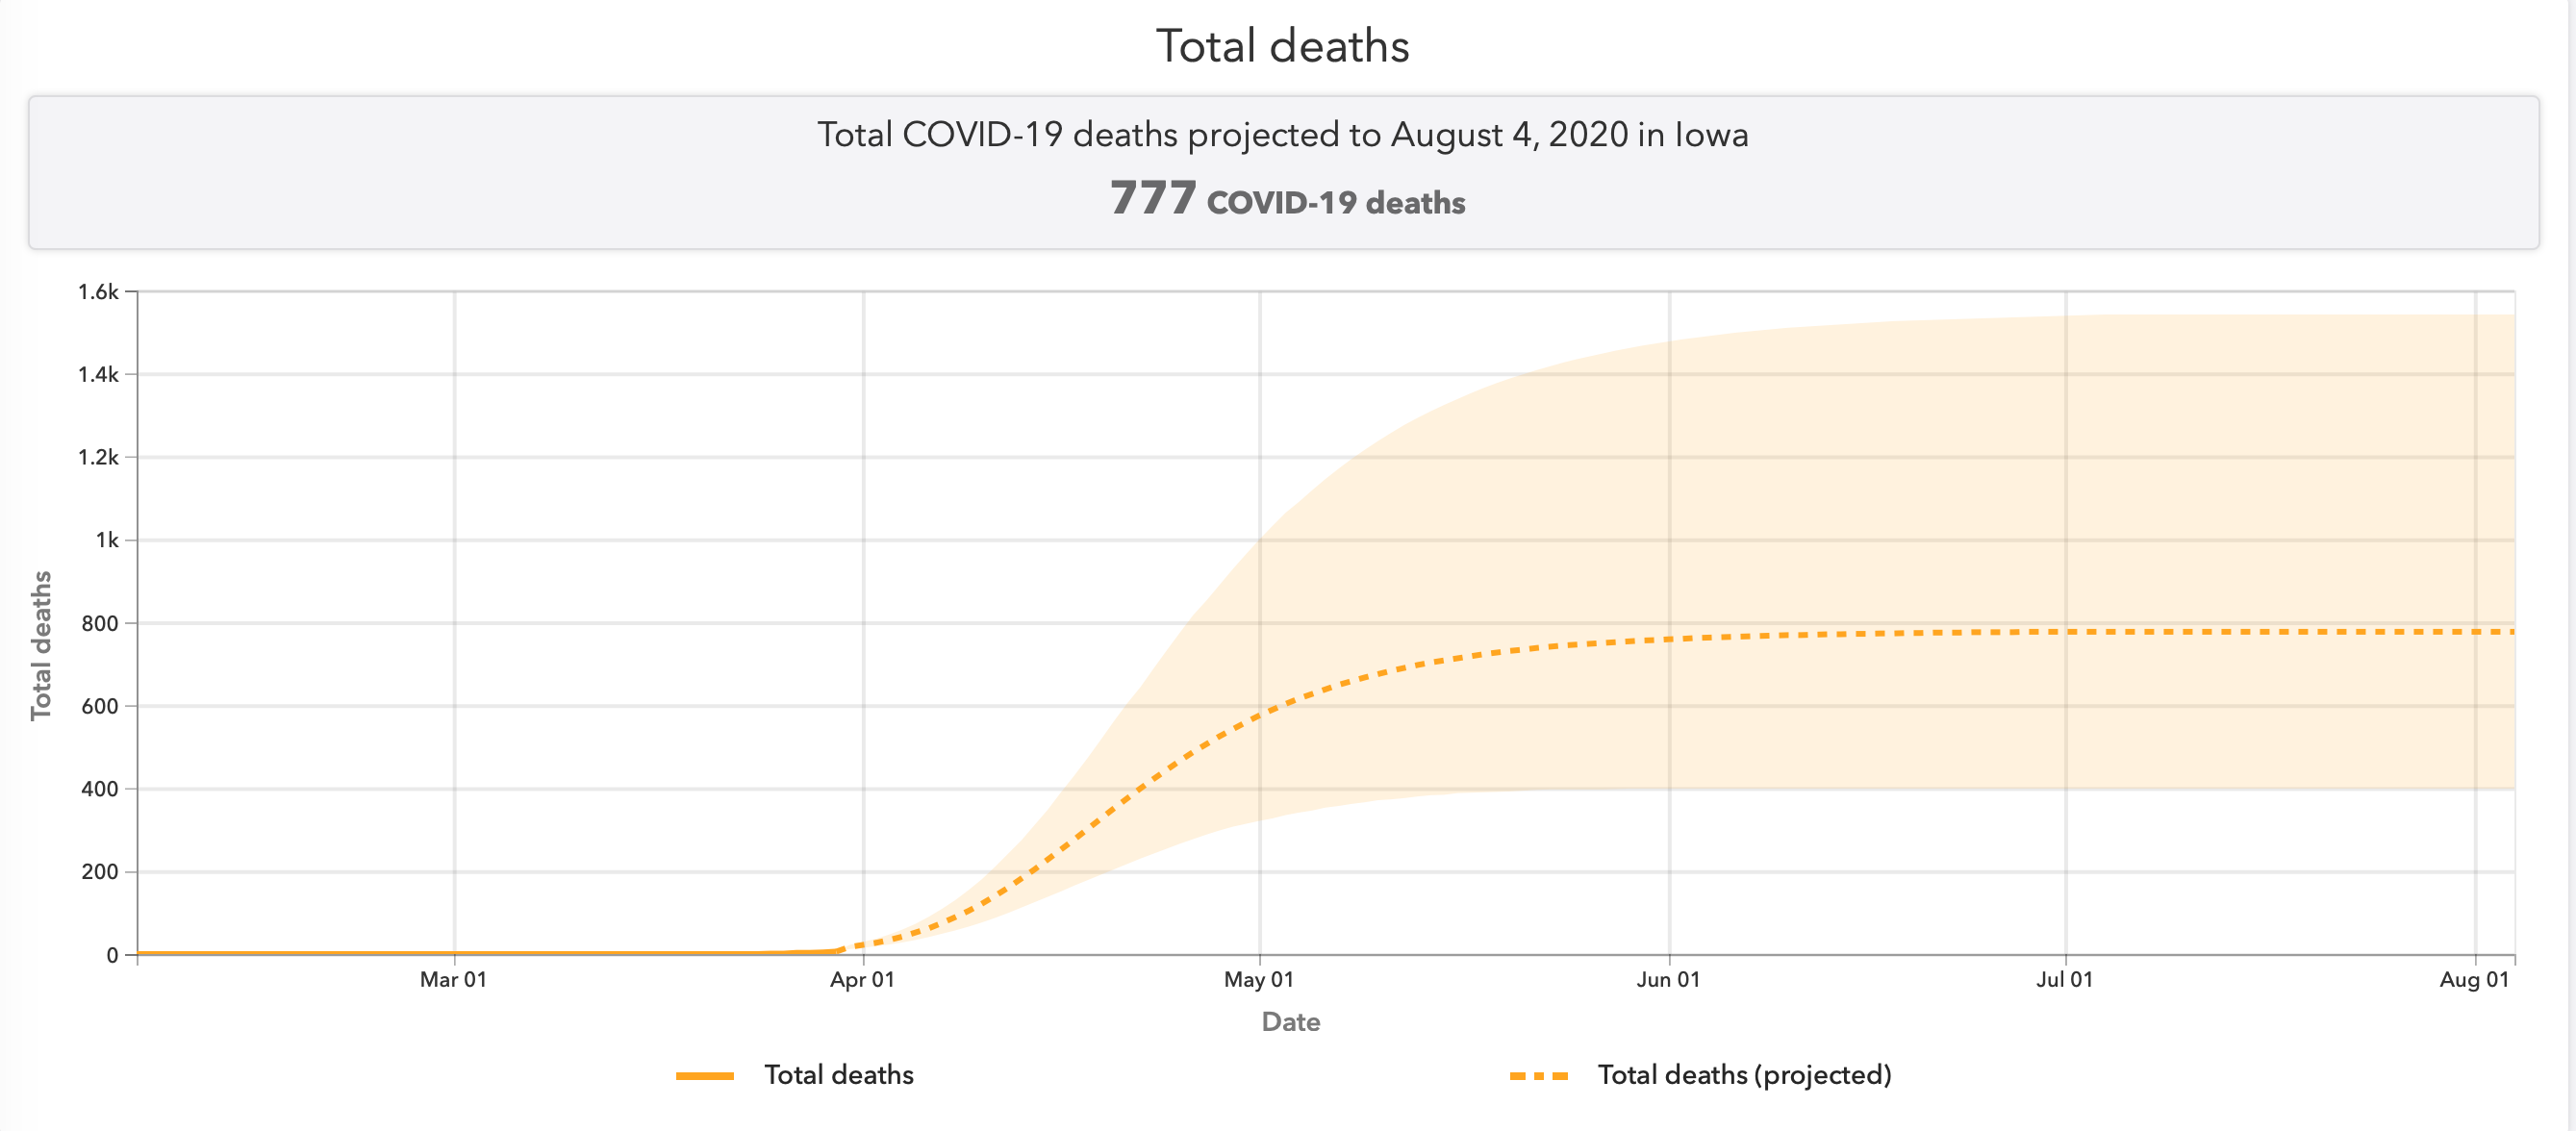
Minnesota’s current projection of 1,039 fatalities works out to 0.00019 of the state’s population. Iowa’s projected 777 deaths equal 0.00025 of its population, slightly higher. But this isn’t due to any apparent curve flattening in Minnesota, as both states show a peak resource use on April 18. Similarly, Florida’s fatality projection of 5,568 works out to 0.00026 of the state’s population. Florida has no stay-home order and hasn’t closed nonessential businesses. Missouri has no shutdown order and has not closed nonessential businesses, and its predicted death total of 1,219 represents 0.00019 of its population, the same as Minnesota’s.
Further, I can’t see from studying the IHME’s charts that the infection curves, or resource usage curves, are any flatter for the states that have shutdown orders than for the states that don’t. You can look at them for yourself and see if you think I am missing something. All indications are that this model is drastically different from those that have been used to justify radical prophylactic measures in Minnesota and other states.
For one thing, the model relied on by the State of Minnesota assumes that 2.4 million Minnesotans will catch COVID-19, and 3 percent of them will die. That 3 percent mortality rate is regarded by most observers as ridiculous. It is double the mortality rate for confirmed cases in South Korea, for example. Moreover, with a population of 51 million and the epidemic now dying out there, South Korea has recorded only 162 deaths—0.000003 of its population. Why do some modelers assume the U.S. will do so poorly? Let’s see the assumptions and the calculations.
The University of Washington is to be commended because its model is relatively transparent, although, for the reasons stated, it leaves lots of questions unanswered. But all models that are used to drive public policy decisions should be fully transparent. We should be able to see, in detail, the assumptions and calculations on which each model depends, so we can critique them.
For example, what do the models assume about the manufacture and supply of more ventilators? Many efforts to build and procure ventilators are being made. To cite just one instance, President Trump has ordered General Motors to produce tens of thousands of ventilators under the Defense Production Act. Have the modelers taken that into account?
The IHME model projects that at the epidemic’s peak on April 15, the nation as a whole will need 26,381 ventilators. Will there actually be a shortage in two weeks’ time, given the massive efforts to produce new ventilators that are now underway? Some common-sense observers would say, if the purpose of shutting down our economy is to assure an adequate supply of ventilators over the coming months, maybe we should forget about destroying the economy and build more ventilators instead.
Further, many more masks are now being produced and made available. It appears that widespread mask usage has helped to limit the spread of the virus in Asia, and “experts” are now backing off their earlier statements that wearing masks would not be useful here. Has the wider utilization of masks been factored into mortality models? Has any modeler tried to figure out whether governors would do more good, at infinitely less cost, by encouraging the wearing of masks rather than by shutting down businesses?
How about promising therapies for COVID-19, like the hydroxychloroquine / azithromycin combination? What do the models assume about the effectiveness of such treatments, and about how soon and how widely they will be deployed? My guess is that they ignore these promising medical developments entirely.
It is also curious that certain policy issues of interest to the public seem never to be addressed by modelers. For instance, President Trump toyed with the idea of quarantining New York City, but backed off after vigorous objections from New York’s Governor Andy Cuomo. But wouldn’t quarantining New York (or just banning flights out of New York, as Scott and Paul have advocated) have flattened the curve elsewhere? And isn’t it an article of faith among modelers that flattening the curve saves lives? Why has no one, as far as I know, attempted this analysis? After all, to quote Governor Cuomo, if quarantining New York saved just one life, it would be worth it. Why, in this case, are our modelers so discreet?
Is curve flattening, via stay-home orders and business closures, really as valuable as certain modelers and many politicians allege? It may be that if the models now being used to generate newspaper headlines were made fully transparent and subjected to rigorous analysis, the value of stretching out the COVID-19 epidemic to flatten the demand curve for medical services would prove to be minimal. And yet, this is the theory on which millions of American lives are now being ruined.
PAUL ADDS: In my response to an earlier post by John, to which he refers above, I didn’t purport to explain differences between two models — a model by the University of Washington (the IHME model) and some model relied on the by governor of Minnesota. I said nothing about Minnesota’s governor, his model, or his order.
I did not say or suggest that the difference between the number of deaths in Minnesota predicted by the University of Washington model and the Minnesota governor’s model — 1,039 vs. more than 70,000 — is explained by the efficacy of stay-home order, business closings, restrictions on meetings, etc. Nor did I attempt to quantify the benefit of the Minnesota governor’s stay-home order. My post did not address that order or the governor’s model, whatever it might have been.
What I said was that the number of deaths projected in the University of Washington model John was citing, 81,000, “assumes the strong measures that have been taken to limit the spread of this virus in the U.S.” and that “without these measures, the University of Washington would very likely be projecting a great many more than 81,000 deaths.” I certainly did not suggest that the University of Washington would be projecting anything remotely like 70 times that number of deaths in the absence of strong measures.