One of the problems with evaluating global warming claims is that the temperature record has been corrupted. Custodians of the various temperature data sets are generally global warming zealots, and they have gone back and changed the temperature records of the past, e.g. by lowering the temperatures that were recorded during the 1930s, to make “climate change” hysteria seem more plausible.
At the same time that records custodians make such dubious “adjustments,” they do nothing to compensate for factors that really do distort the record, pre-eminently the Urban Heat Island Effect. There is no question that weather stations in cities are affected by urban development that increases local temperatures for reasons that have nothing to do with climate. A large part of the increase in temperatures that has been recorded over the last 50 years is due to the Urban Heat Island Effect.
Starting in 2005, the National Oceanic and Atmospheric Administration, the custodian of U.S. weather records, created a data set that was deliberately free from UHIE distortion. For some reason, though, NOAA doesn’t seem to publicize these data. Watts Up With That? explains. Links omitted:
The graph shows the Average Surface Temperature Anomaly for the contiguous United States since 2005. The data comes from the U.S. Climate Reference Network (USCRN) which is a properly sited (away from human influences and infrastructure) and state-of-the-art weather network consisting of 114 stations in the USA.
These station locations were chosen to avoid warm biases from Urban Heat Islands (UHI) effects as well as microsite effects as documented in the 2022 report Corrupted Climate Stations: The Official U.S. Surface Temperature Record Remains Fatally Flawed. Unfortunately, NOAA never reports this data in their monthly or yearly “state of the climate report.” And, mainstream media either is entirely unaware of the existence of this data set or has chosen not to report on this U.S. temperature record.
Most likely they prefer not to report on it. Because here is the graph:
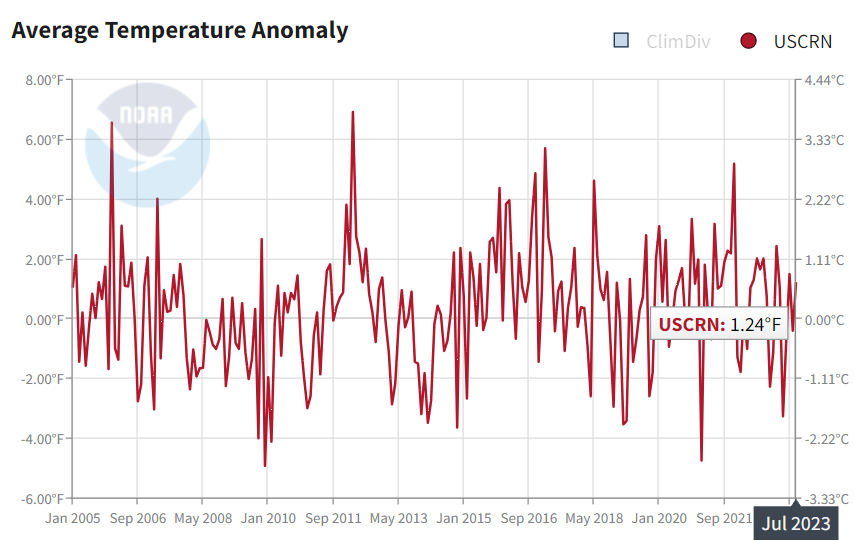
Go ahead, try to find evidence of Catastrophic Anthropogenic Global Warming.
Notice: All comments are subject to moderation. Our comments are intended to be a forum for civil discourse bearing on the subject under discussion. Commenters who stray beyond the bounds of civility or employ what we deem gratuitous vulgarity in a comment — including, but not limited to, “s***,” “f***,” “a*******,” or one of their many variants — will be banned without further notice in the sole discretion of the site moderator.