This graphic comes from my friend and colleague John Phelan. Ask yourself, without looking: what does it show?

It shows the states that were fully under the control of either the Democrats or the Republicans in 1993–i.e., the states that had “trifectas.” (Nebraska has a unicameral legislature, so we can call that an exacta.) It is hard to remember now, but in 1993 there were nineteen states where the Democrats had full control, largely in the south, while only three states were held by Republicans. In most states, power was shared between Republicans and Democrats.
Fast forward to 2023. This is what the map looks like now. Currently, there are 39 states that are either all red or all blue, and the pattern has changed completely:
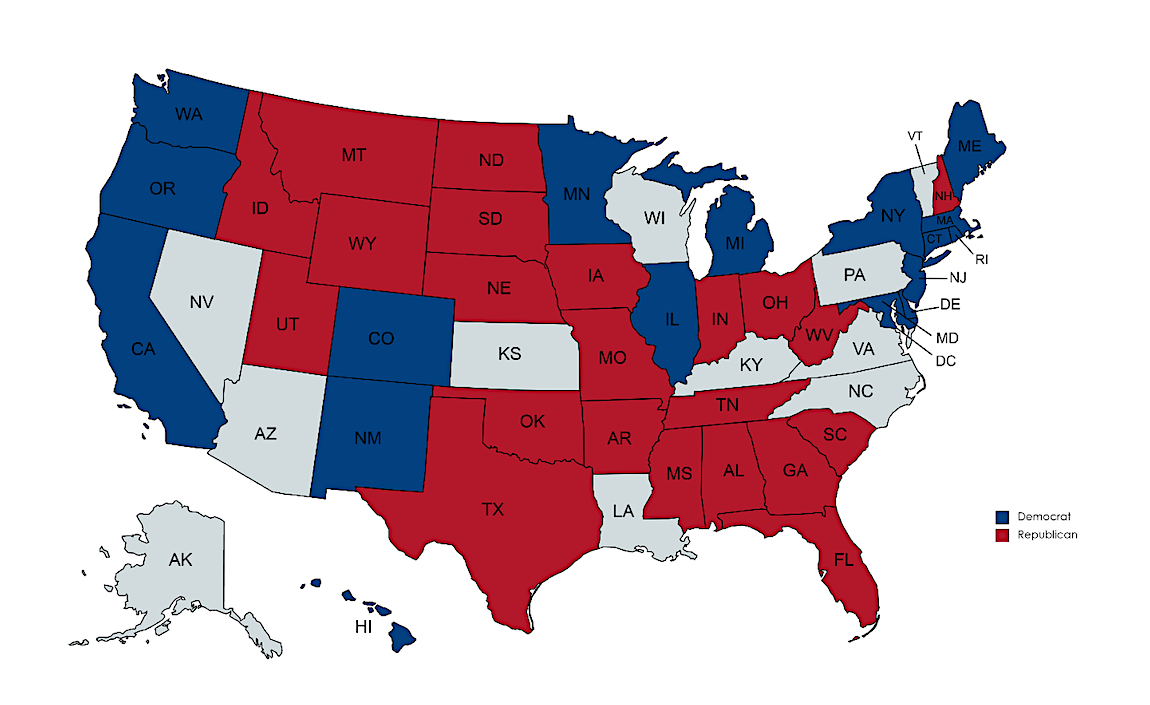
This is a dramatic visual illustration of how Americans are sorting themselves into red and blue blocs. It is also a reminder of how quickly things can change, culturally as well as politically.